



By the summer of 1944, London knew what being bombed felt like — it had four years of practice. What arrived that June was something else. It wasn’t that the new German weapon did more damage; it was that nobody could tell where it would fall, or whether anyone was aiming it at all.
And that’s the thing about us humans — we tend to invent the meaning about what we don’t know. Show a person pure randomness and they’ll hand you back a pattern: a lucky street, a cursed corner, a run of luck that has to mean something. It almost never does. Telling a real pattern from one your own mind conceived is one of the oldest problems in data, and the fix is always the same — stop looking, start counting.
The buzz in the sky
The tide of war was finally turning and Britain was just starting to breathe again — D-Day was barely a week old, the Allies were finally clawing their way into France, and for the first time in years things were looking better. Then, on 13 June 1944, something new came droning across the Channel and dropped out of the sky onto London.
A flat, rattling buzz could be heard from miles off, then it would cut off, giving you a handful of seconds to ponder whether the damn thing was falling on you. Londoners named it fast, the way they named everything that scared them. The doodlebug. The buzz bomb.

German V-1 flying bombs were unmanned machines that would fly themselves across the sea to hit a target city. Back in 1944, it seemed closer to science fiction than warfare. Around ten thousand were fired at England over the months that followed; some 2,400 got through to London, killing more than six thousand people.
Strip off the 1940s fittings and the V-1 is unsettlingly modern. A little jet engine on its back, a gyroscope to hold a heading, and a tiny propeller on the nose ticking down the miles until it hit a preset count and tipped the whole thing into its dive. No human aboard. It flew itself to a target and detonated. We have a word for that now, and it isn’t “bomb.” It’s cruise missile. The V-1 is the straight-line ancestor of the Tomahawk, and it turned up the better part of forty years ahead of schedule, which is more or less how it felt on the ground.

And that is where the fear turned into something stranger. The bombs fell out of a clear sky with no pattern anyone could name — a direct hit here, an untouched street one block over. So people did what people always do with randomness they can’t bear: they started to see a plan in it.
Enter Clarke, and the cold comfort of statistics
The man who settled it wasn’t a general. He was a statistician from a life insurance company, working on wartime “Special Duties” for the Ministry of Aircraft Production. It wasn’t his personal hobby project — he counted V-1s while they were literally falling from the sky. In secret.
The scientific paper that shone light on the whole effort only surfaced after the war, in 1946, as a short note in the Journal of the Institute of Actuaries. And “short” is underselling it. The entire investigation — the setup, the math, the answer — fits on a single page.
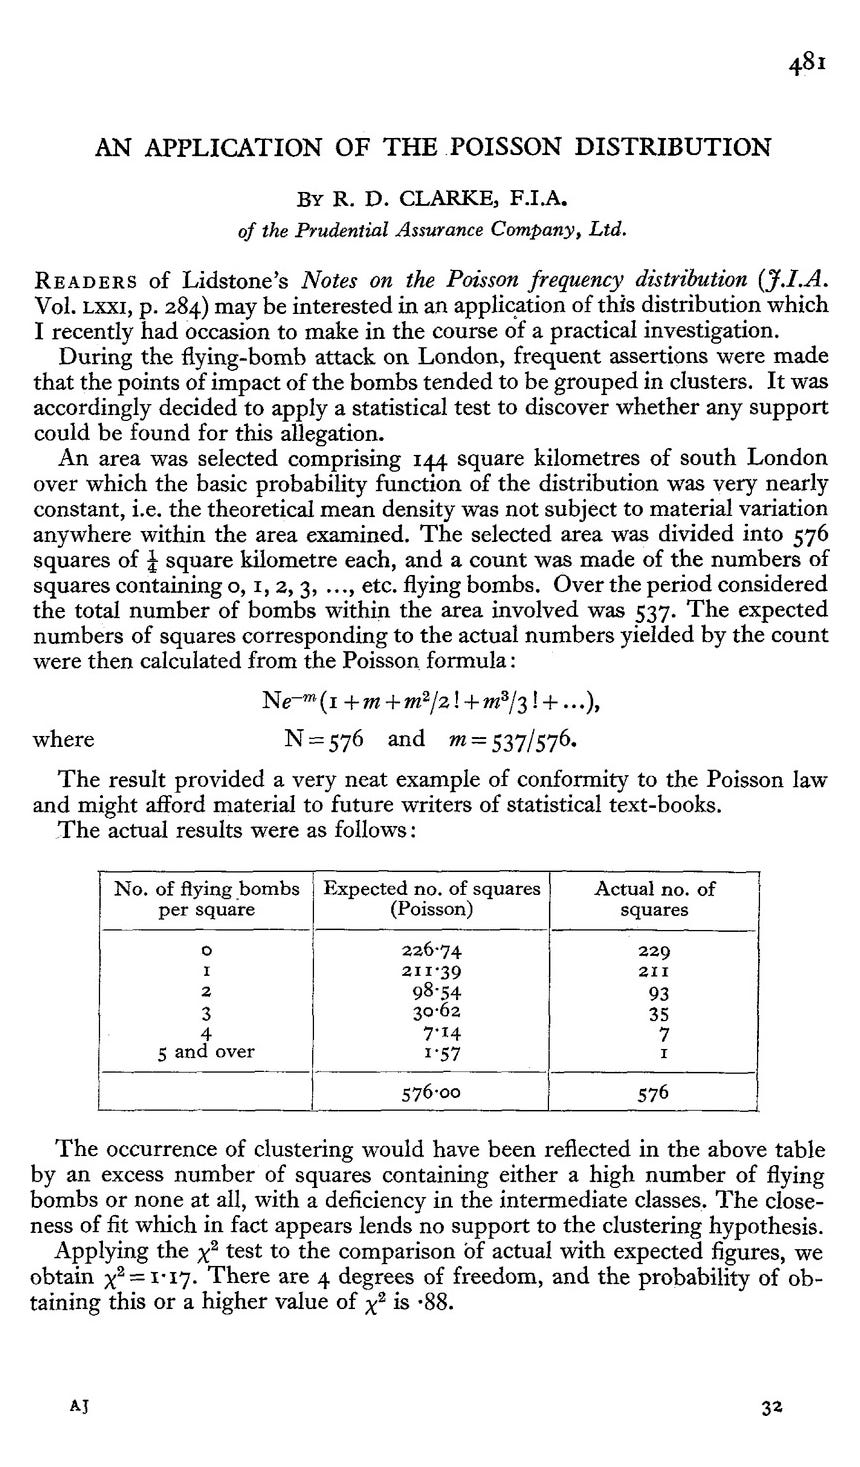
What he did was simple to describe. He took a slab of South London, 144 square kilometers of it, and drew a grid: 576 equal squares, each a quarter of a square kilometer. Then he counted. Across that grid, 537 flying bombs had come down, and for every square he tallied the score — how many were never hit, how many were hit once, twice, three times.
Here was the test. If the Germans could really aim these things, the hits should bunch up. The squares they were aiming at would get pounded again and again, and the rest would sit quiet. But if the bombs were landing blind, the pattern would follow a specific, unromantic law of probability: the Poisson distribution.
Poisson is the math of rare things sprinkled at random — think raindrops landing on the pavement. You feed it one number, the average rate, and it tells you exactly how the totals should split up when nothing is steering them. Here the average was easy: 537 bombs across 576 squares, a shade under one hit per square. From that single number, Poisson predicts how many squares should escape untouched, how many should be hit once, twice, and so on down the line.
Then Clarke laid his real counts next to what the formula predicted.
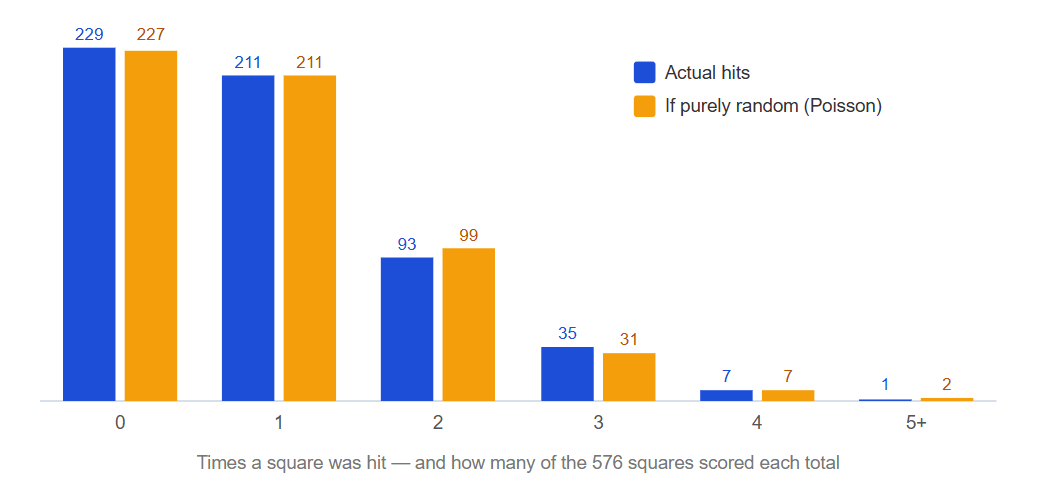
The chart above (created by us, not Clarke, mind you) shows a nearly identical numbers between statistical probability of “pure chance” and the reality, suggesting one significant revelation: the V-1s weren’t choosing targets — they were falling like rain.
The cursed streets and the lucky streets that everyone in London swore they could see were real in exactly one sense: randomness is lumpy. Scatter 537 of anything across 576 boxes and you always get clusters and bare patches, purely by chance. Our brains spot the clusters and go looking for a reason. Clarke’s research showed there wasn’t one.
Stats, turned into tactical advantage
There’s a grim irony folded into Clarke’s findings: the same randomness that made the V-1 so frightening also made it, in one narrow but crucial way, manageable.
You can’t control the randomness of the scatter, but you can move the middle. And that’s roughly what British intelligence did. The V-1 couldn’t correct itself in flight or see where it landed — the Germans’ only feedback came from spies and newspapers.
So the Double Cross operation fed them a lie: captured German agents, by then quietly working for MI5, reported that the bombs were consistently overshooting central London. The bet was that Berlin would shorten the range to compensate, dragging the average impact point short of the city center and out into the less dense southern suburbs.
Pulling the mean south meant more bombs on boroughs like Croydon and fewer on Westminster. It saved lives by choosing whose lives to risk, and nobody involved pretended that was a clean call.
That’s what 576 squares bought: not a way to stop the bombs, but a way to stop believing untrue things about them. The Londoners who swore they’d found the pattern weren’t fools, and they weren’t seeing things — the clusters were real. They just didn’t mean anything. Randomness almost never looks random. It looks like intent, and it keeps looking like intent right up until someone stops staring at the map and starts counting.
Your data does the same to you. The cursed corner, the lucky street, the streak that has to mean something. Clarke needed one page and 576 little squares to settle it. Stop looking. Start counting.
DataViz Dojo was created by amCharts team. We’re not here to peddle you our data-viz lib. We’re here to have fun with facts, data, cartography, and history, blending it all into beautiful visual stories. Subscribe, follow, or simply check in regularly for more compelling stuff!