

Not All SVG Maps Are Created Equal
Making a sense of projections, centering, and other aspects of vector representation of maps.

TL;DR
If we’d get 10 cents every time someone asked us for a such and such vector map, we’d be… uh, no idea what we’d be, but the point is there’s a strong demand for vector maps. And not just classic ones, like the one you remember from your classroom.
There are tens if not hundreds of map projections.
There are different versions of the same maps - both the world but also for individual countries.
There are Atlantic-centered maps, and the ones focused on the Pacific.
Flat maps or the globe.
Colored or monochrome. With or without graticule grid.
You get the drift.
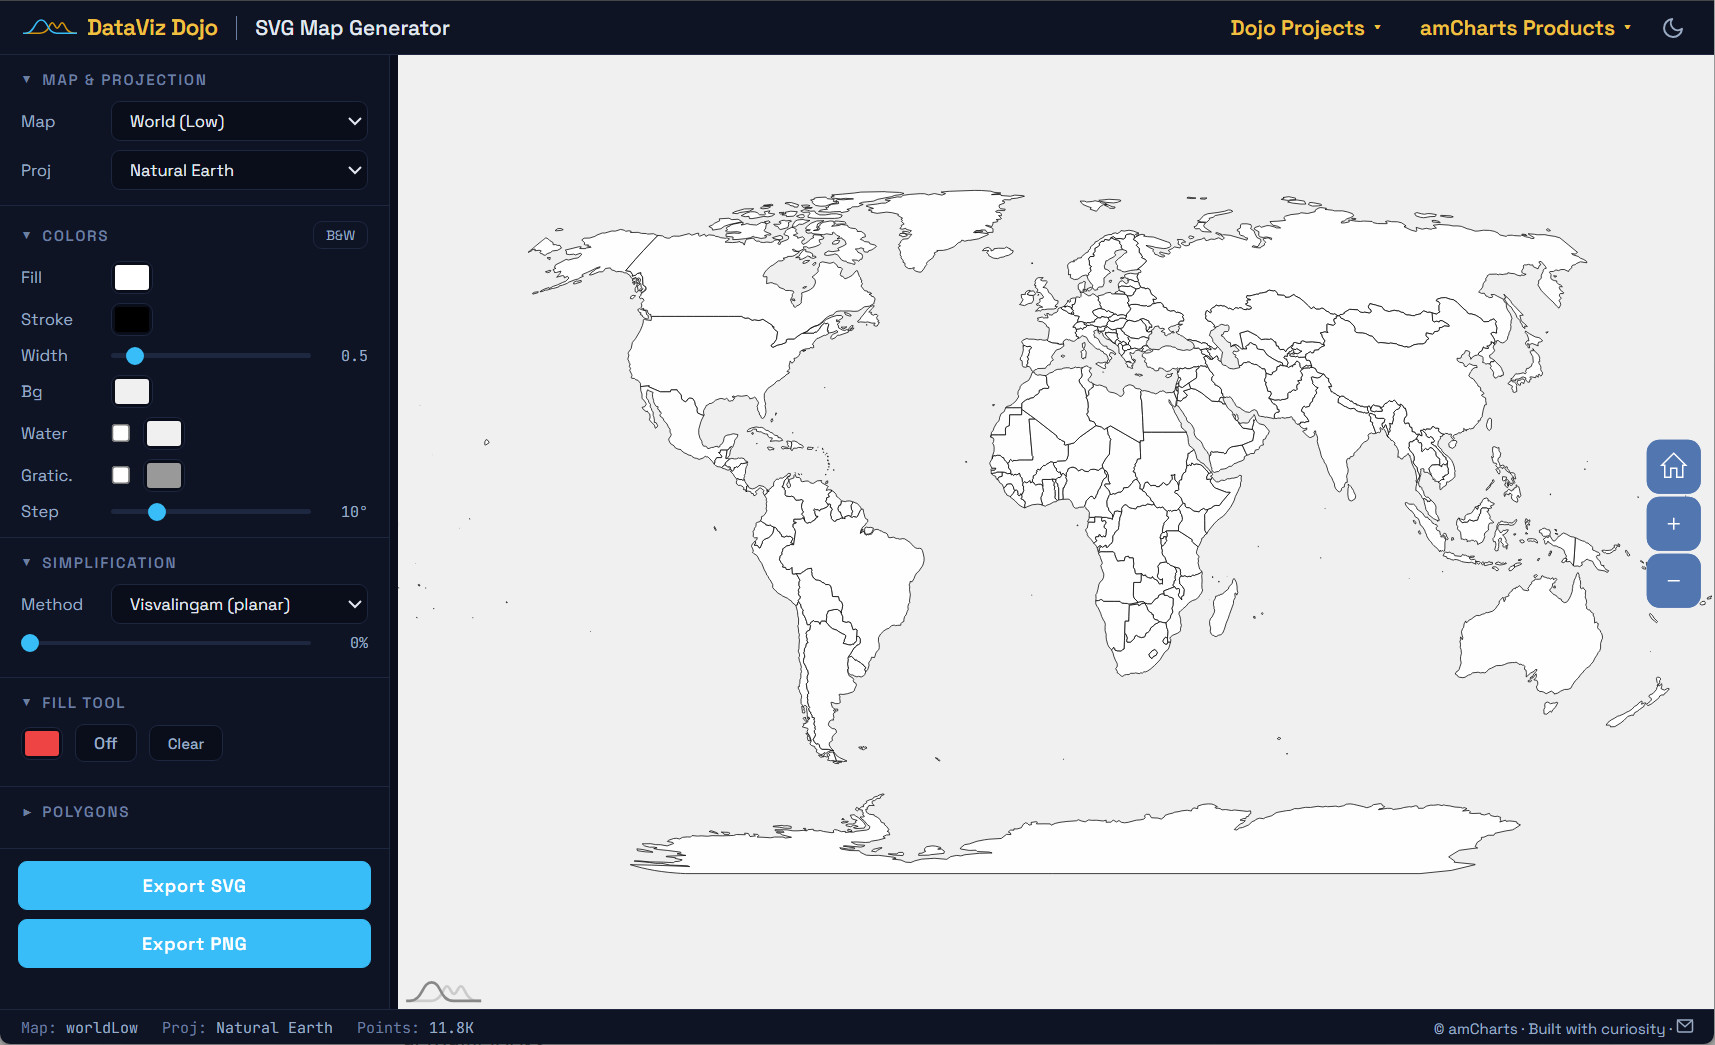
That’s why we’ve built a new tool: SVG Map Generator.
It’s free, and super flexible. Just select a world, regional, or country map, the settings and grab a freshly minted SVG file. Free. No strings attached.
Whoa, give me all the nitty gritty detail
Fine, you asked for it. Treat the text below as a detailed round up of SVG Map Generator’s features. A sort of documentation. Here we go.
Choose the Right Projection
The good news is there are tons of projections that handle area much more honestly. Our SVG Map Generator offers 90+ projections, organized by type:
Equal Earth - General-purpose world maps. Equal-area, visually appealing.
Natural Earth - Thematic & editorial maps. Compromise: slight distortion, pleasant shape.
Robinson - Wall maps, atlases. Compromise projection, National Geographic standard.
Winkel Tripel - Reference maps. Minimizes overall distortion (area + shape + distance).
Gall-Peters - Area-accurate comparisons. Strictly equal-area (shapes are stretched).
Mollweide - Distribution maps. Equal-area, elliptical shape.
Orthographic - Globe icons, perspective views. Shows Earth as seen from space.
You can switch between all of these instantly in the tool, preview the result, and export a clean SVG with the projection you actually want.
Pacific-Centered Maps
Here’s one that comes up a lot: what if you need a map centered on the Pacific instead of the Atlantic? If you’re working with Asia-Pacific data, the standard Atlantic-centered world map cuts the Pacific right in half, splitting Asia from the Americas.
In the tool, just drag the map to the position you want and hit export. The SVG comes out centered exactly as you see it. No post-processing, no coordinate hacking.


This works with any projection. Want a Pacific-centered Equal Earth? Robinson? Mollweide? Just rotate and export.
Simplification: Less Is More
Here’s another issue with most SVG maps you find online: they’re bloated. A typical “low-detail” world map SVG might have 11,000+ coordinate points. For dashboards, infographics, or thumbnails, that’s massive overkill. You’re shipping hundreds of kilobytes of path data that nobody can even see at normal display sizes.
Our tool has built-in TopoJSON simplification. Drag a slider, watch points disappear, and the map stays perfectly recognizable. Here’s the same world map at three levels:


That 90%-simplified map is 3x smaller than the original and still perfectly usable for dashboards, illustrations, or any context where you don’t need to zoom into individual coastlines. The tool supports both planar and spherical simplification, so you can pick whichever best preserves the shapes you care about.
137 KB: Original
85 KB: 50% simplified
45 KB: 90% simplified
Regional Maps: Only What You Need
Sometimes you don’t need the whole world. Maybe you’re building a European sales dashboard or a North American logistics tool. Loading a full world map and then zooming to your region is wasteful - you’re downloading paths for countries you’ll never show.
The tool includes 100+ map sources, with dedicated regional maps for every continent and sub-region:


Each map comes with proper country id attributes (ISO codes) and title tags, making it trivial to style individual countries with CSS or hook up interactions with JavaScript.
Globe Icons with Orthographic Projection
Need a small map icon or a globe thumbnail for your app? The orthographic projection shows the world as if viewed from space. It’s a natural, intuitive look that works great at small sizes.
In the tool, switch to orthographic projection, rotate the globe to show the region you want, and export. You get a clean, lightweight SVG globe:


These use a simplified continents map with no country borders, just clean landmass silhouettes. Pure SVG, no JavaScript, no dependencies. They scale to any size, look sharp on retina displays, and weigh just 15-17 KB each.
Animated SVG Globe
Here’s a fun one. You can take it a step further and create an animated spinning globe, entirely in SVG, no JavaScript needed. Generate multiple orthographic frames at different rotation angles, combine them with CSS animations, and you get a smoothly rotating globe:

This uses a heavily simplified world map (95% of points removed) to keep the file size manageable. Each frame is a separate group in the SVG, with CSS keyframes toggling their visibility. The result: a self-contained animated globe you can drop into any webpage, email, or presentation.
Maps as Icons
Sometimes you don’t need a detailed map at all, just a tiny recognizable shape. A favicon, a logo element, a loading indicator. For those cases, push simplification to the extreme and strip away country borders entirely, leaving just continent silhouettes.
Combine maximum simplification with the right projection, and you get map icons that are just a few kilobytes:
At 5-9 KB, these are smaller than most PNG icons, and they scale perfectly to any size. Use them as inline SVGs in your HTML or reference them as image files. Resolution-independent, crisp on any screen.
Country Maps
The tool doesn’t just do world maps. It includes individual maps for 100+ countries, each with internal subdivisions (states, provinces, departments). Perfect for country-specific dashboards, election maps, or regional analysis:


Each subdivision gets its own <path> element with an id attribute, so you can target them individually with CSS:
#JP-13 { fill: #ef4444; }  /* Highlight Tokyo */
#BR-SP { fill: #3b82f6; }  /* Highlight São Paulo */
#FR-75 { fill: #10b981; }  /* Highlight Paris */
The USA and Albers Projection
Remember my Alaska story? Here’s where it gets practical. The US spans a huge east-west distance, and Alaska and Hawaii are geographically far from the mainland. On a standard Mercator map, showing all three wastes a ton of space and makes Alaska look way bigger than it actually is (which is exactly why I lost my sense of scale in the first place).
That’s why the Albers USA projection exists. It’s a composite projection built specifically for the US: it uses a conic equal-area projection for the lower 48 states, then tucks Alaska (scaled down) and Hawaii (repositioned) into insets below. This is the standard projection used in government statistics, election maps, and pretty much any serious US data visualization.


Our tool includes Albers USA alongside all the standard options. Pick a USA map source and it shows up automatically in the projection dropdown. The exported SVG keeps the inset layout intact, ready for dashboards, infographics, or election night.
Color Customization & Paint Mode
The tool includes a paint mode that lets you color individual countries or regions right in the browser. Choose a color, click on a country, and the SVG export preserves your custom colors as CSS rules. Great for creating quick thematic maps without writing any code.
You can also tweak the global fill color, stroke color and width, background, and graticule styling. Everything updates live in the preview and gets baked into the exported SVG.
Clean, Semantic SVG Output
Unlike many SVG map tools that spit out opaque, tangled markup, our generator produces clean, readable SVG:
Every country path has an
idattribute (ISO country code) and atitleStyles live in a
<style>block, easy to overrideNo inline transforms, no nested groups, no JavaScript
Proper XML declaration and viewBox for correct scaling
Works in any browser, any framework, any CMS
The SVG files are standalone. Drop them into your HTML, your React app, your Figma project, your PowerPoint. They just work.
Toggle & Hide Countries
Need to show only certain countries? The tool has a country list panel where you can hide or show individual countries with a click. When you export, hidden countries are simply excluded from the SVG. This is especially useful for:
Creating maps of specific regions (e.g., EU member states only)
Removing overseas territories you don’t need
Building custom groupings (e.g., BRICS nations, NATO members)
Want Something Fancier? Pixel Maps
If you’re after a different aesthetic - maps made of dots, squares, hexagons, or diamonds - check out our Pixel Map Generator. Same idea (pick a projection, pick a map source, export), but instead of smooth vector paths, it renders the map as a grid of shapes.

Great for infographics, dashboards with a techy vibe, or anywhere you want a map that looks a bit more stylized. You can tweak the pixel size, gap, colors, and export as SVG, PNG, or even interactive HTML.
Need Interactivity? Use amCharts
SVG maps are great for static visuals, but if you need zooming, panning, tooltips, clickable regions, animated flight routes, or live data updates - you’ll want a proper charting library. That’s what amCharts is for. Check out the map demos gallery to see what’s possible - choropleth maps, bubble maps, drill-downs, animated planes flying along routes, and more. All with a few lines of code.