


5.21 is out. It’s a big one, so here’s the short tour. And before you dismiss this as another boring press release, just scroll and check the visuals. We’ve got something super cool in there. Something you probably didn’t think was possible to do with an off-the-shelf library, and more importantly, without any coding, but more about that later.
No-code charting
Before you ask, everything you see in here (along the rest of stuff you can do with amCharts) can be implemented without writing a single line of code.
Use the new amCharts Chart Maker to create maps and charts, including animations, then download or embed directly into your CMS.
Or, use your favorite coding AI. We’ve made sure they can handle every task you throw at them. We even updated all of our demos to include the AI prompt to build a chart just like that.
SVG rendering
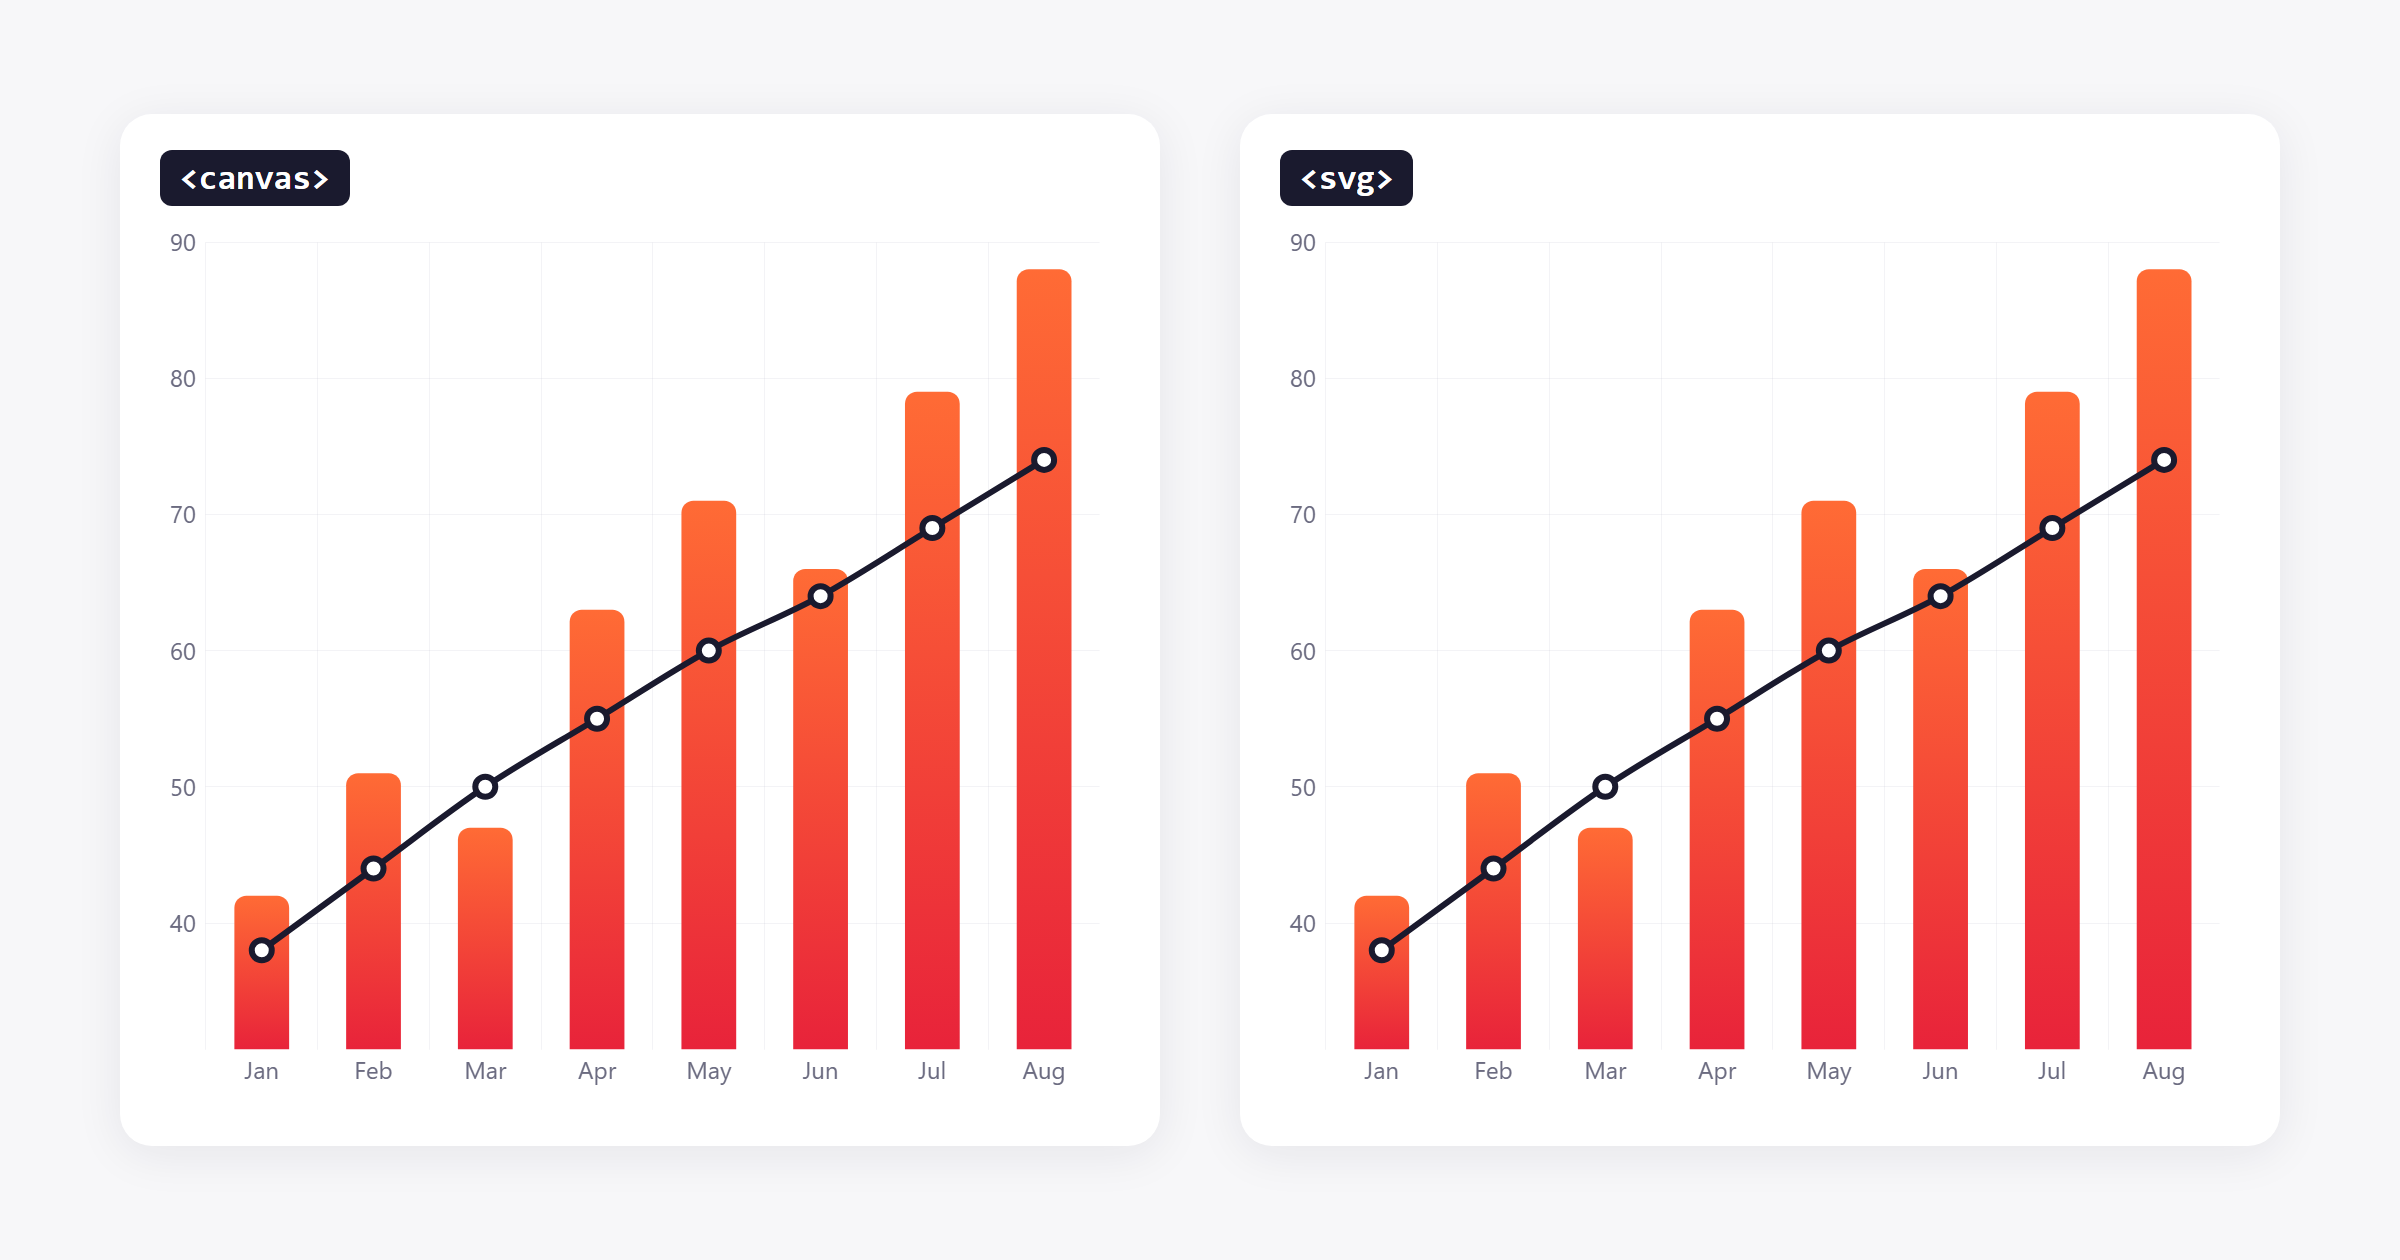
amCharts 5 has always drawn charts on canvas. Now it can draw them as SVG too. One setting when you create the root:
const root = am5.Root.new("chartdiv", {
  renderer: am5.SVGRenderer
});
Same chart, same API, same interactions. Canvas stays the default.
» Docs
SVG export
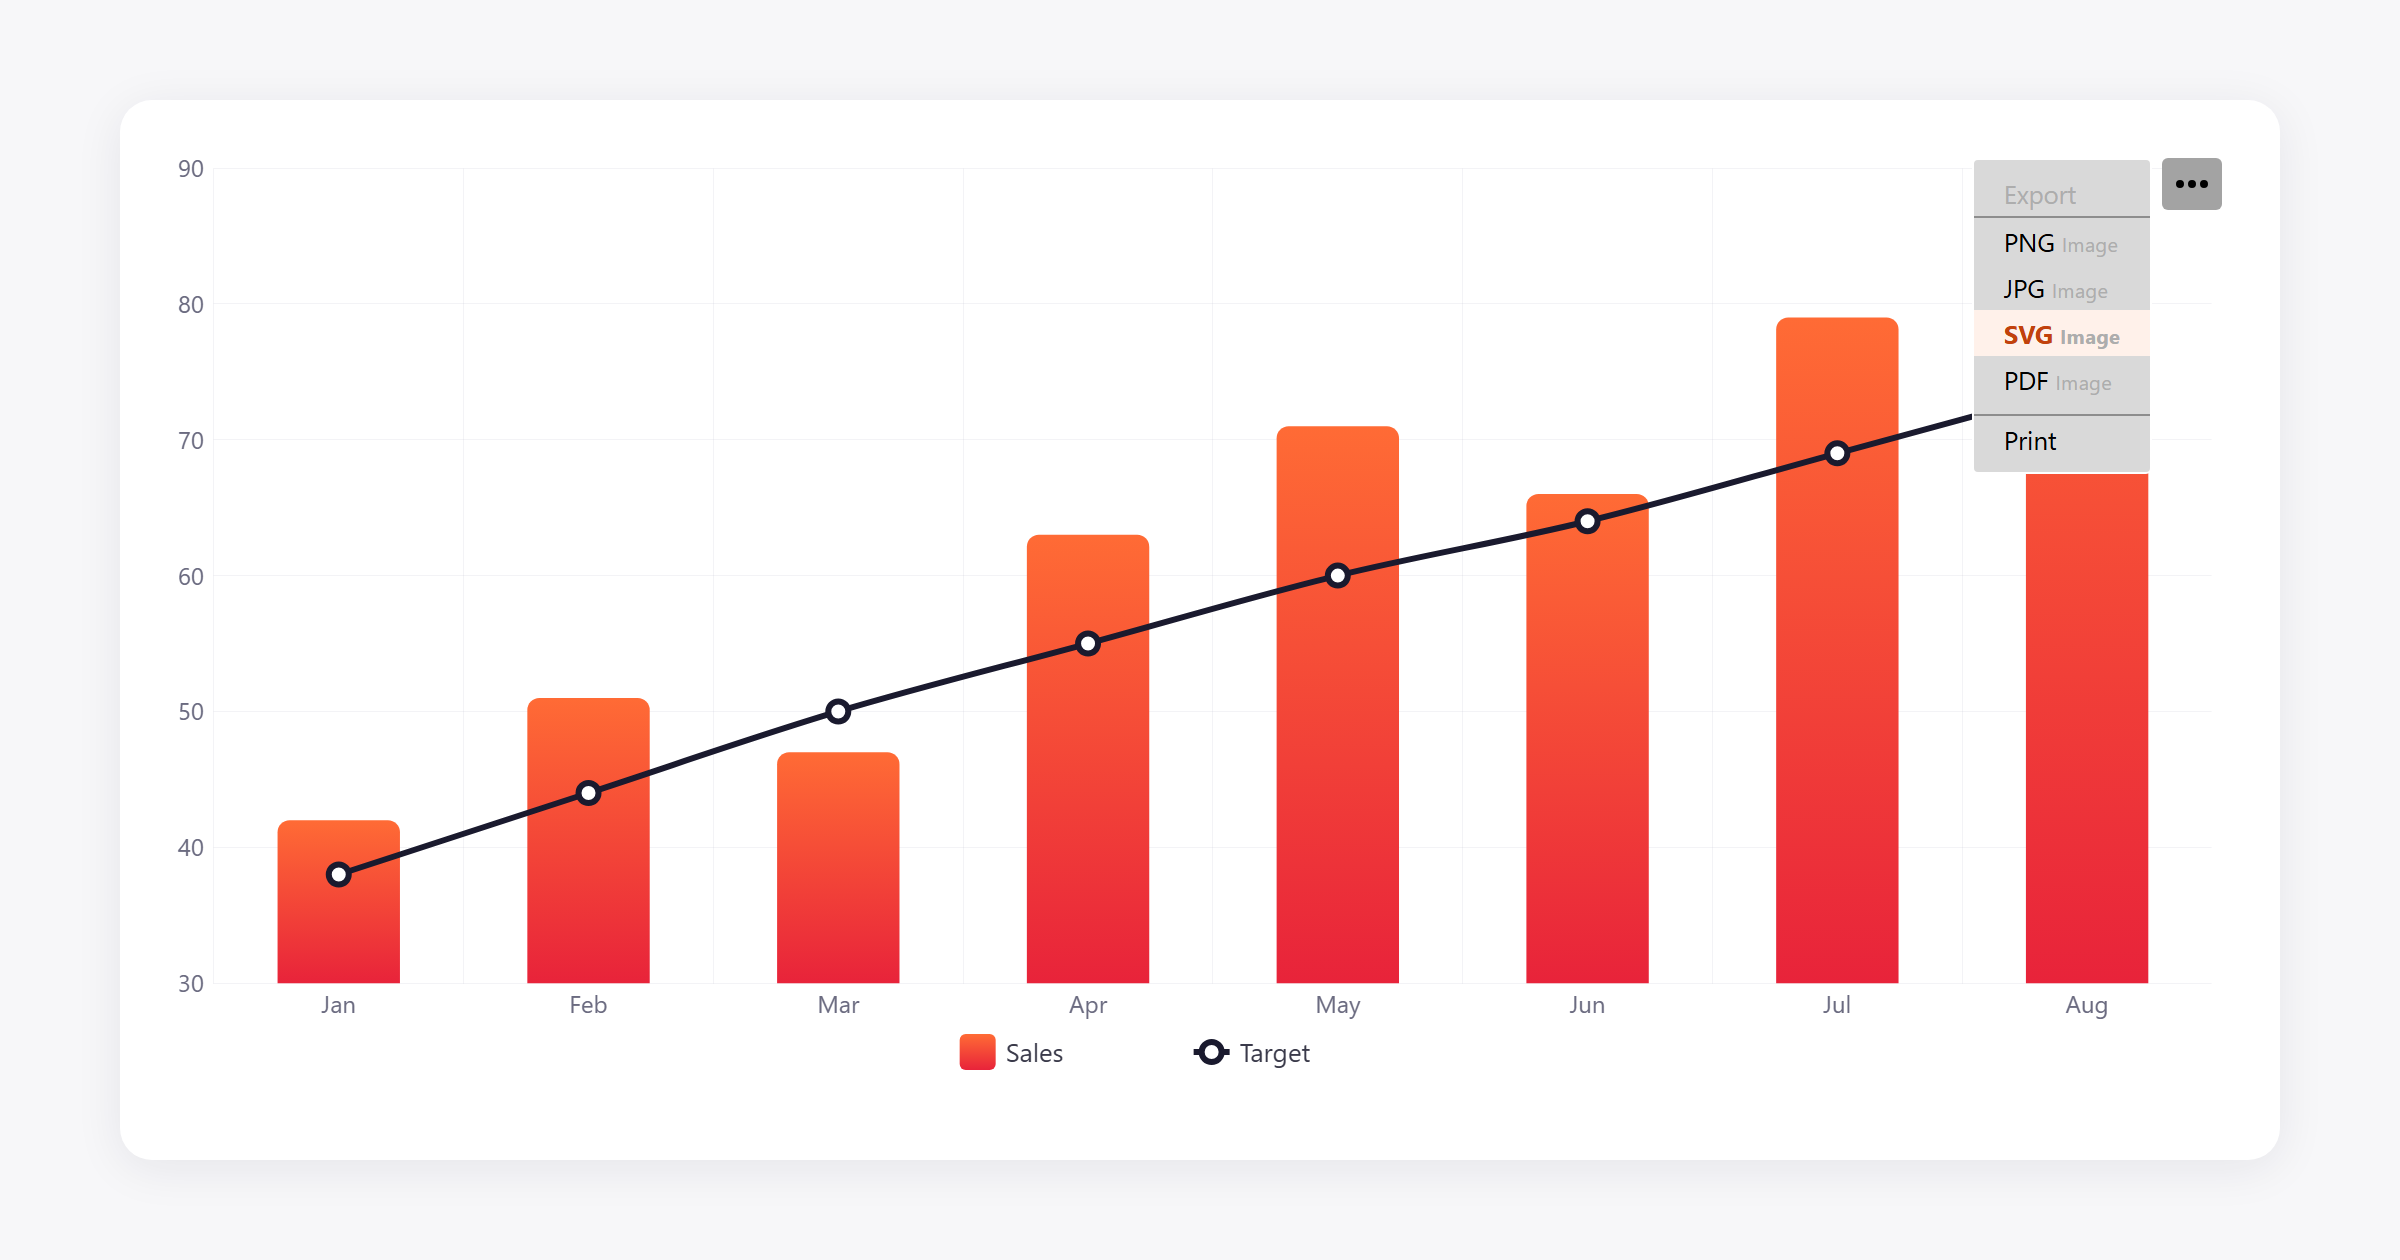
Any chart can now be exported to SVG, whichever renderer draws it. It’s in the export menu by default, or call exporting.download("svg"). Text stays text, so you can open the file in Illustrator or Figma and edit it.
» Docs
Real globes: satellite imagery, day and night, 3D routes
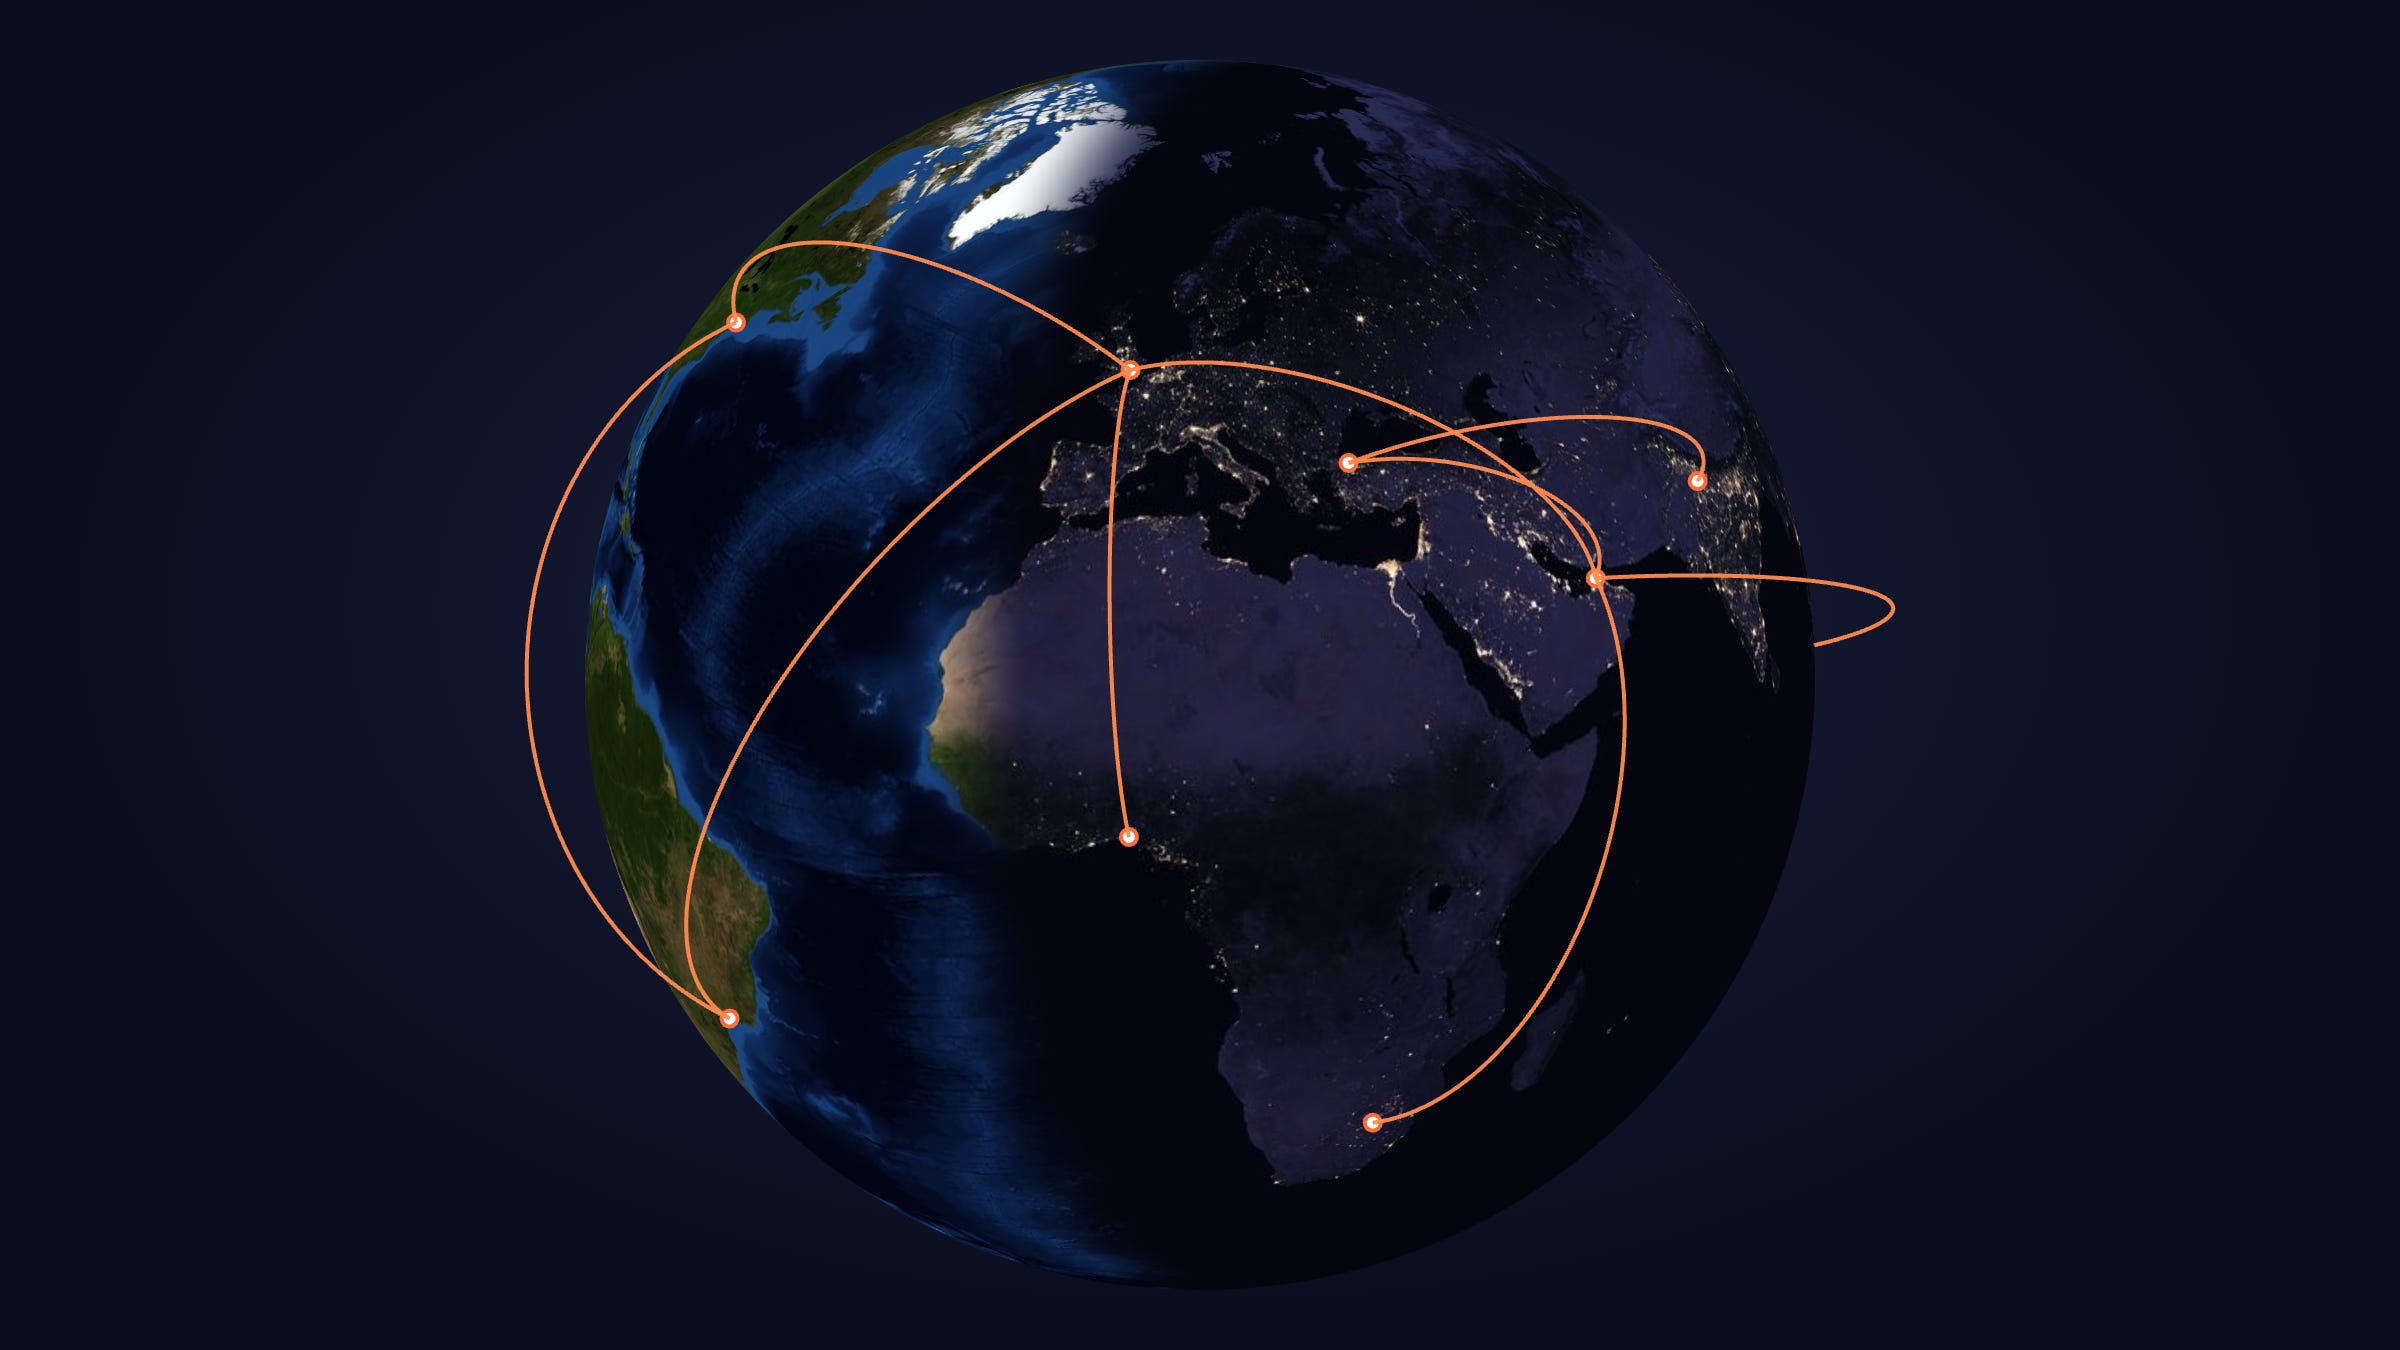
Maps can now show a satellite photo of the Earth that turns and zooms with the map (MapRasterSeries). Give it a night image and a time, and it shows day and night, city lights and all. NightSeries adds the night shading to any map.
Map lines can rise off the surface: set altitude on a line and it arcs above the globe. Points can float at a height too.
Demos:
» Satellite globe
» Map with night series
» Elevated line series
Docs:
» Raster series
» Night series
» Map line series with altitude
Pixel maps
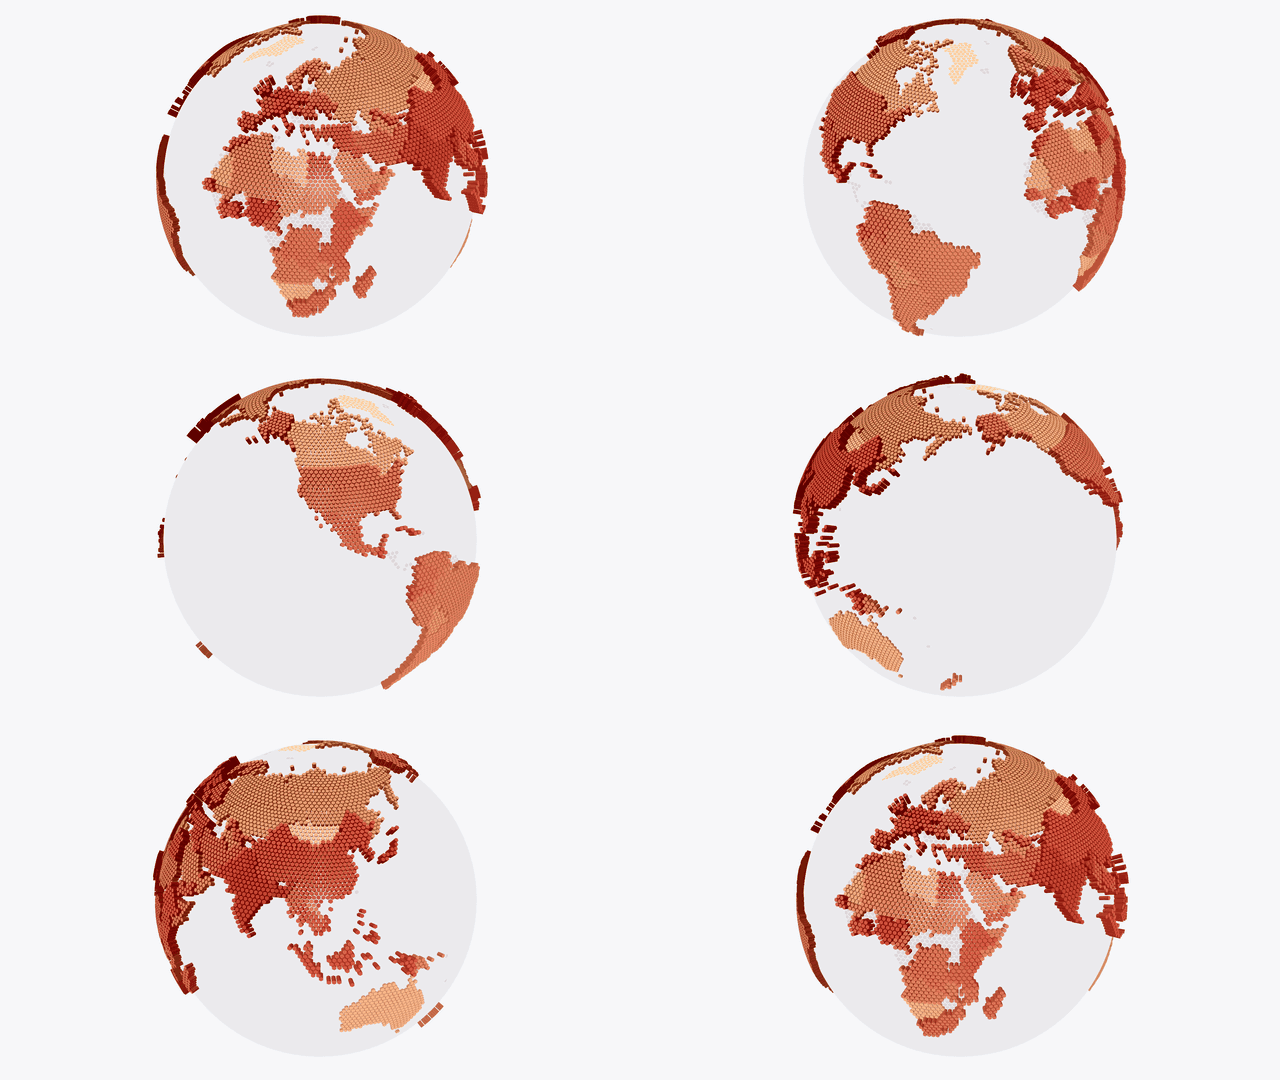
A new way to draw a map: countries as a grid of dots, squares, diamonds or hexagons. Heat rules, tooltips and states work as on a regular map. Pixels can also rise into 3D columns.
» Docs
» Tweakable pixel map demo
A one-tag chart
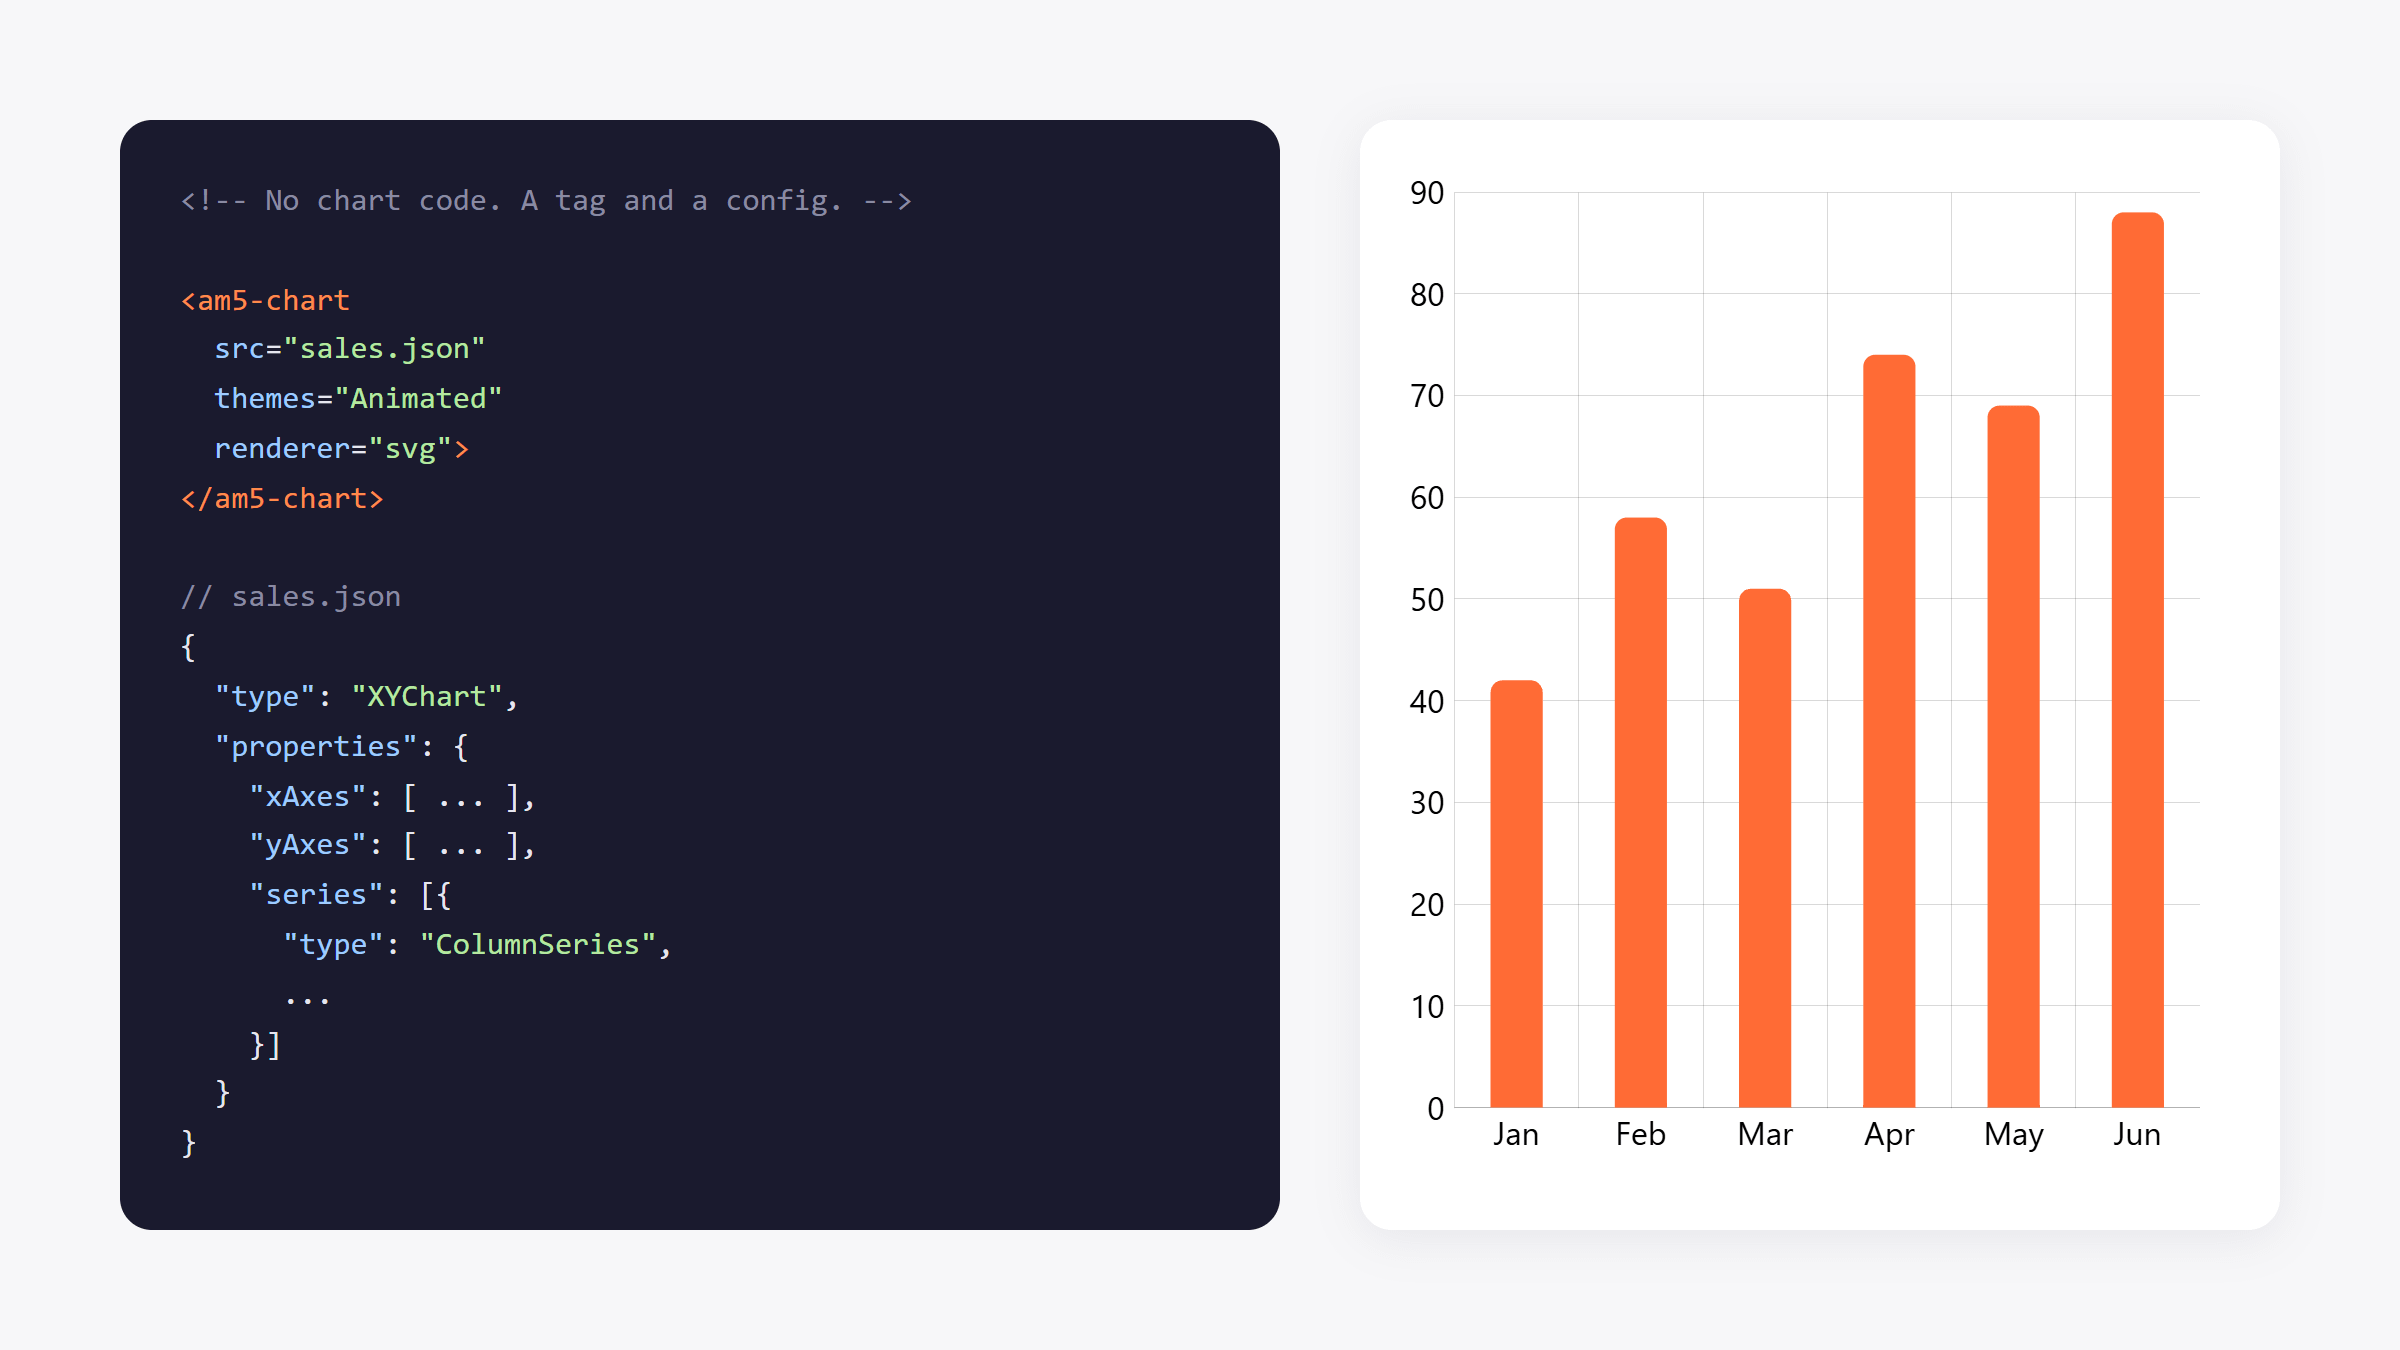
<am5-chart> is a chart as an HTML tag. Point it at a JSON config and it builds the chart. No root, no setup code.
Configs can now carry the animations too (autoAppear, animations), and chart serializer can now serialize a live chart into a JSON, too.
» Docs
Built for AI coding agents
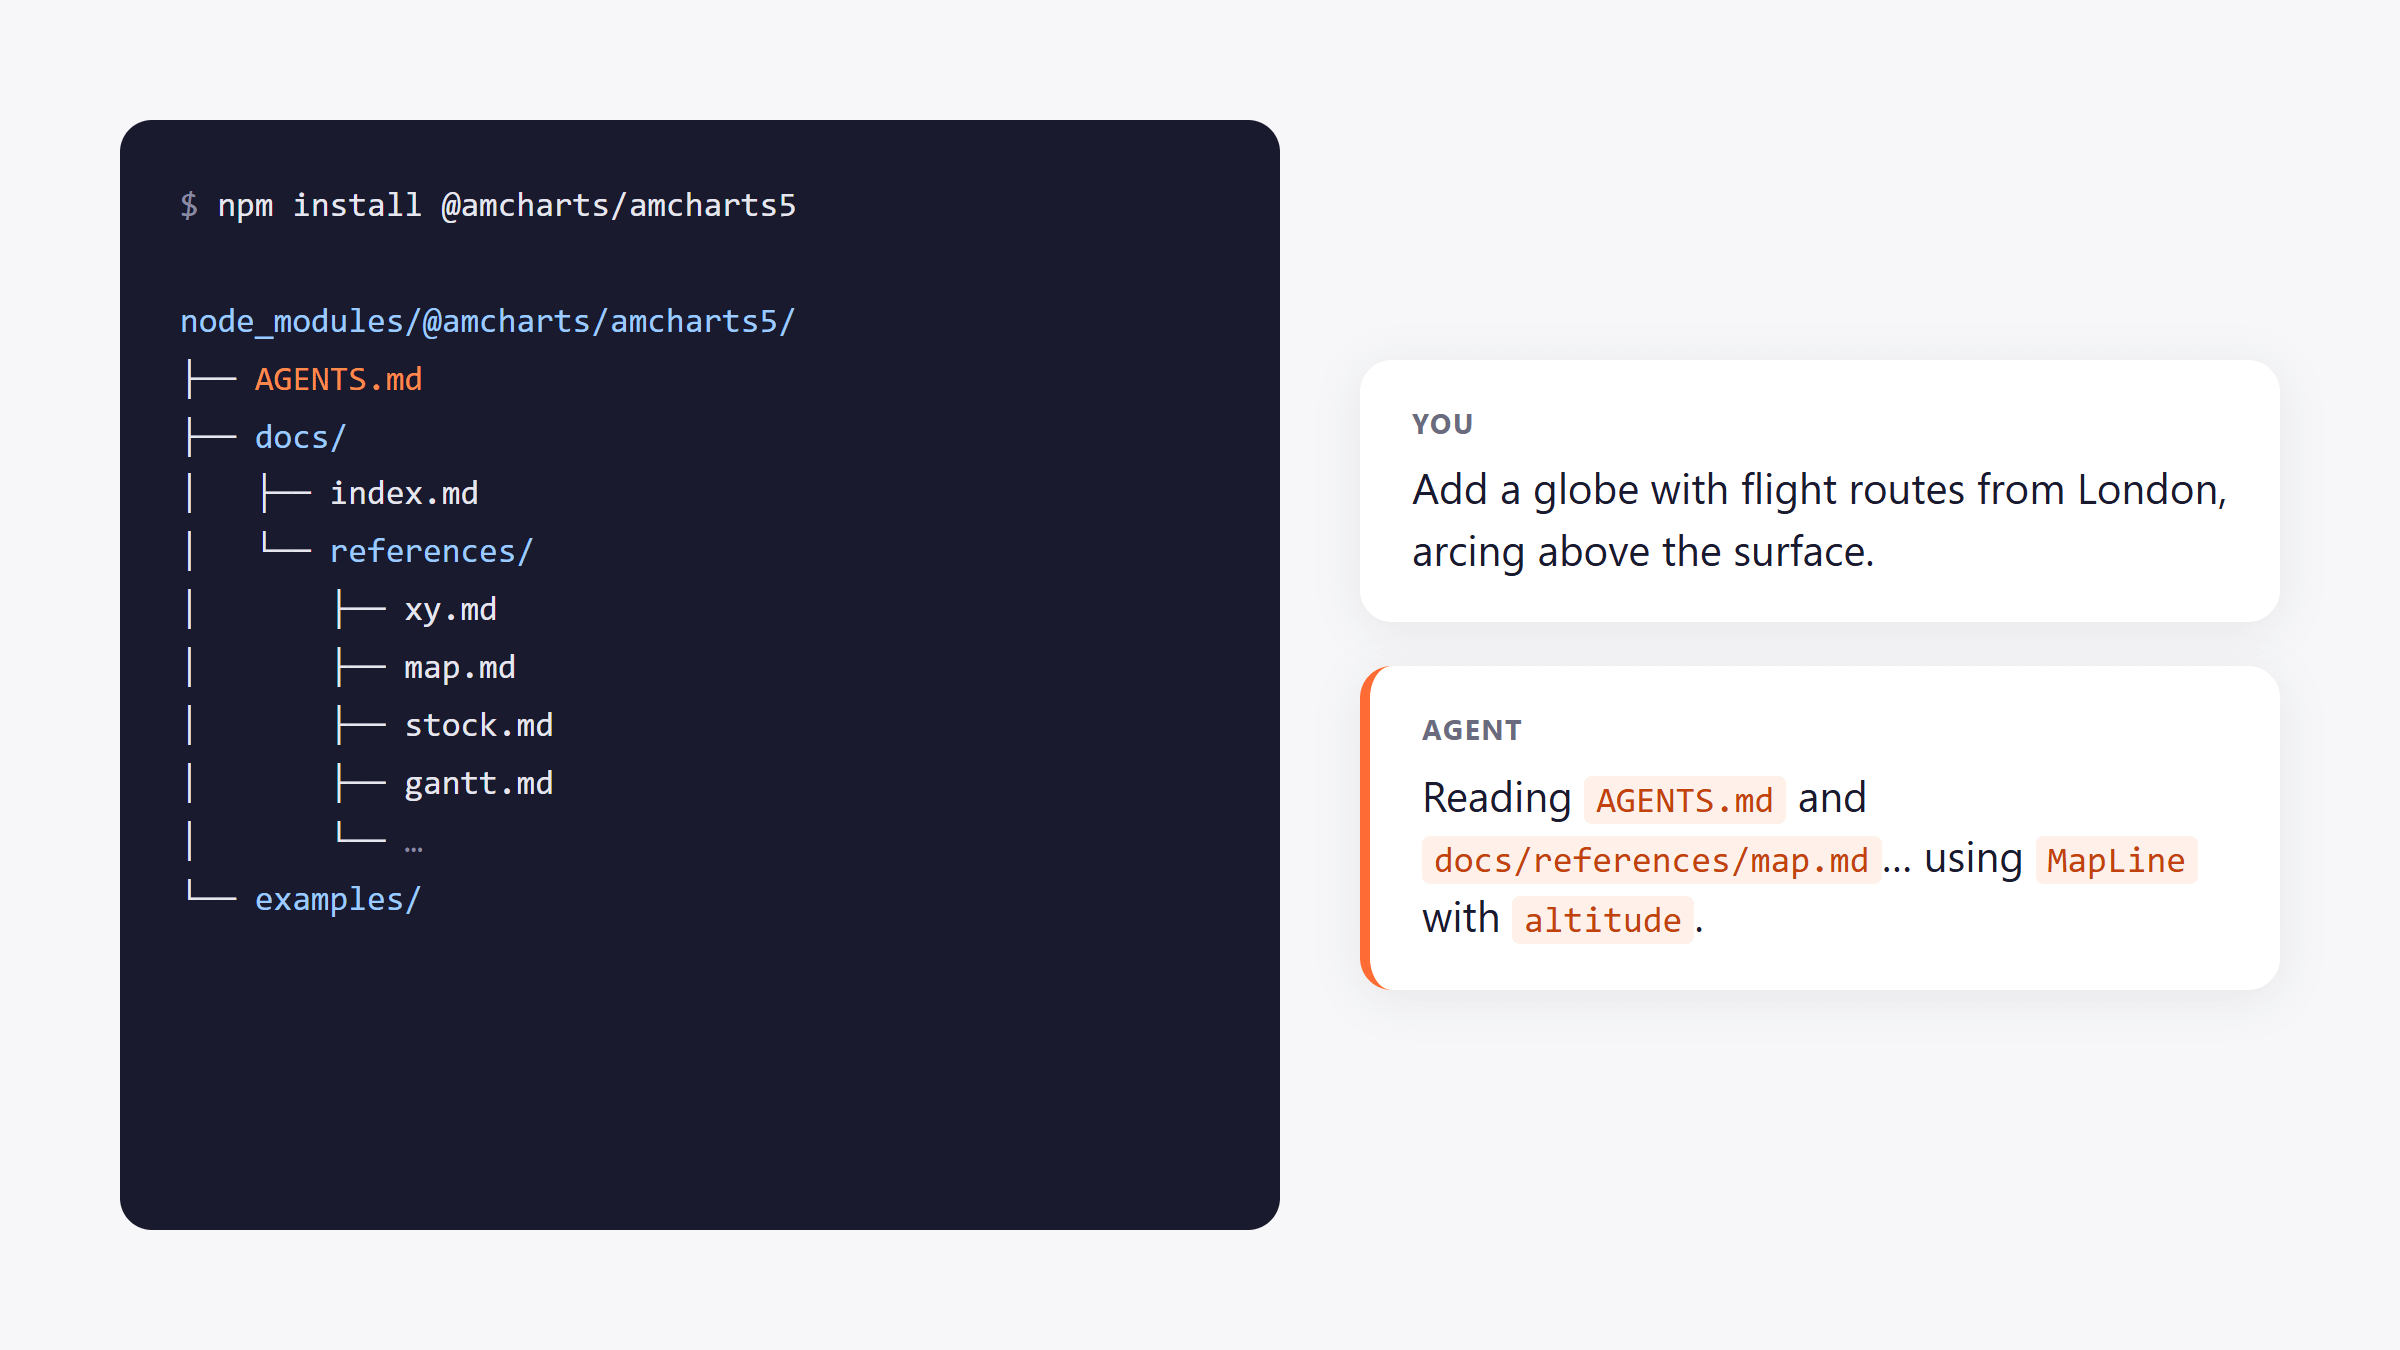
The npm package and the download now include AGENTS.md and a docs/ folder with a reference for every chart type. Claude Code, Cursor, Copilot and the like read it and write amCharts code that works, instead of guessing.
The examples were rewritten too: one file each, with comments that explain the settings.
If you use an MCP-capable tool, the amCharts MCP server gives it the full docs and API reference.
» Docs
Accessibility
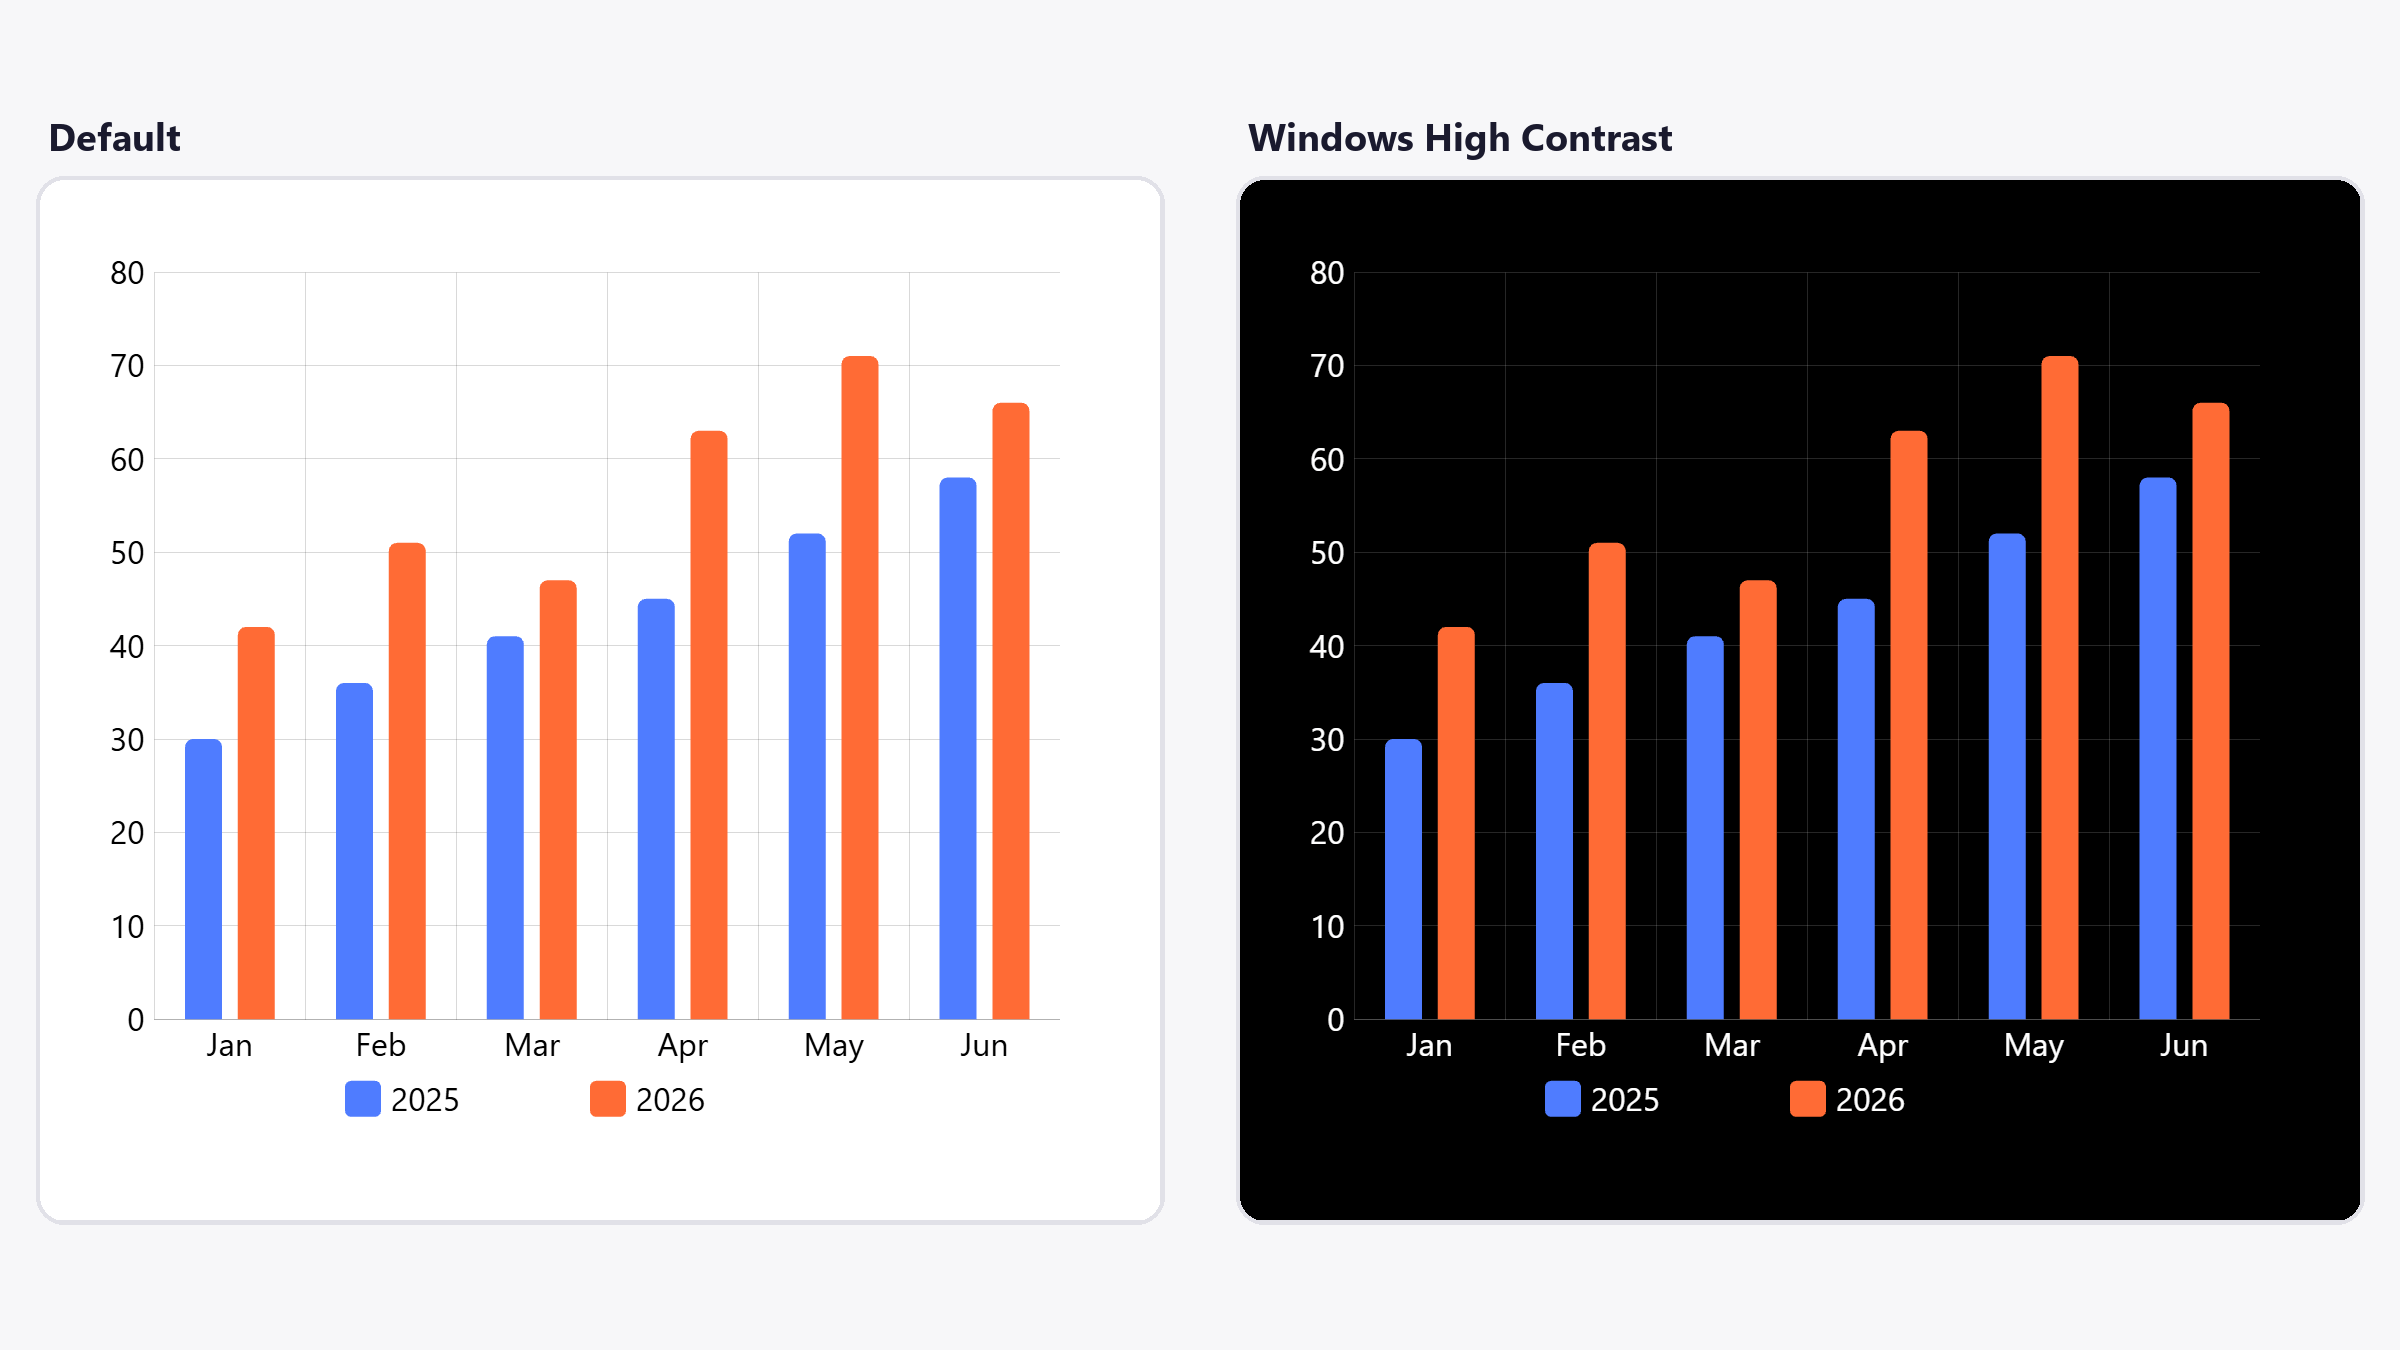
Charts now follow Windows High Contrast mode: labels, grid, axes and buttons take the system colors, so they stay readable. Series colors are kept.
Lots of keyboard and screen reader fixes too: ESC, SPACE and arrow keys behave as expected, dialogs keep focus, icon buttons have names, toggles announce their state.
» Docs
Revamped demos
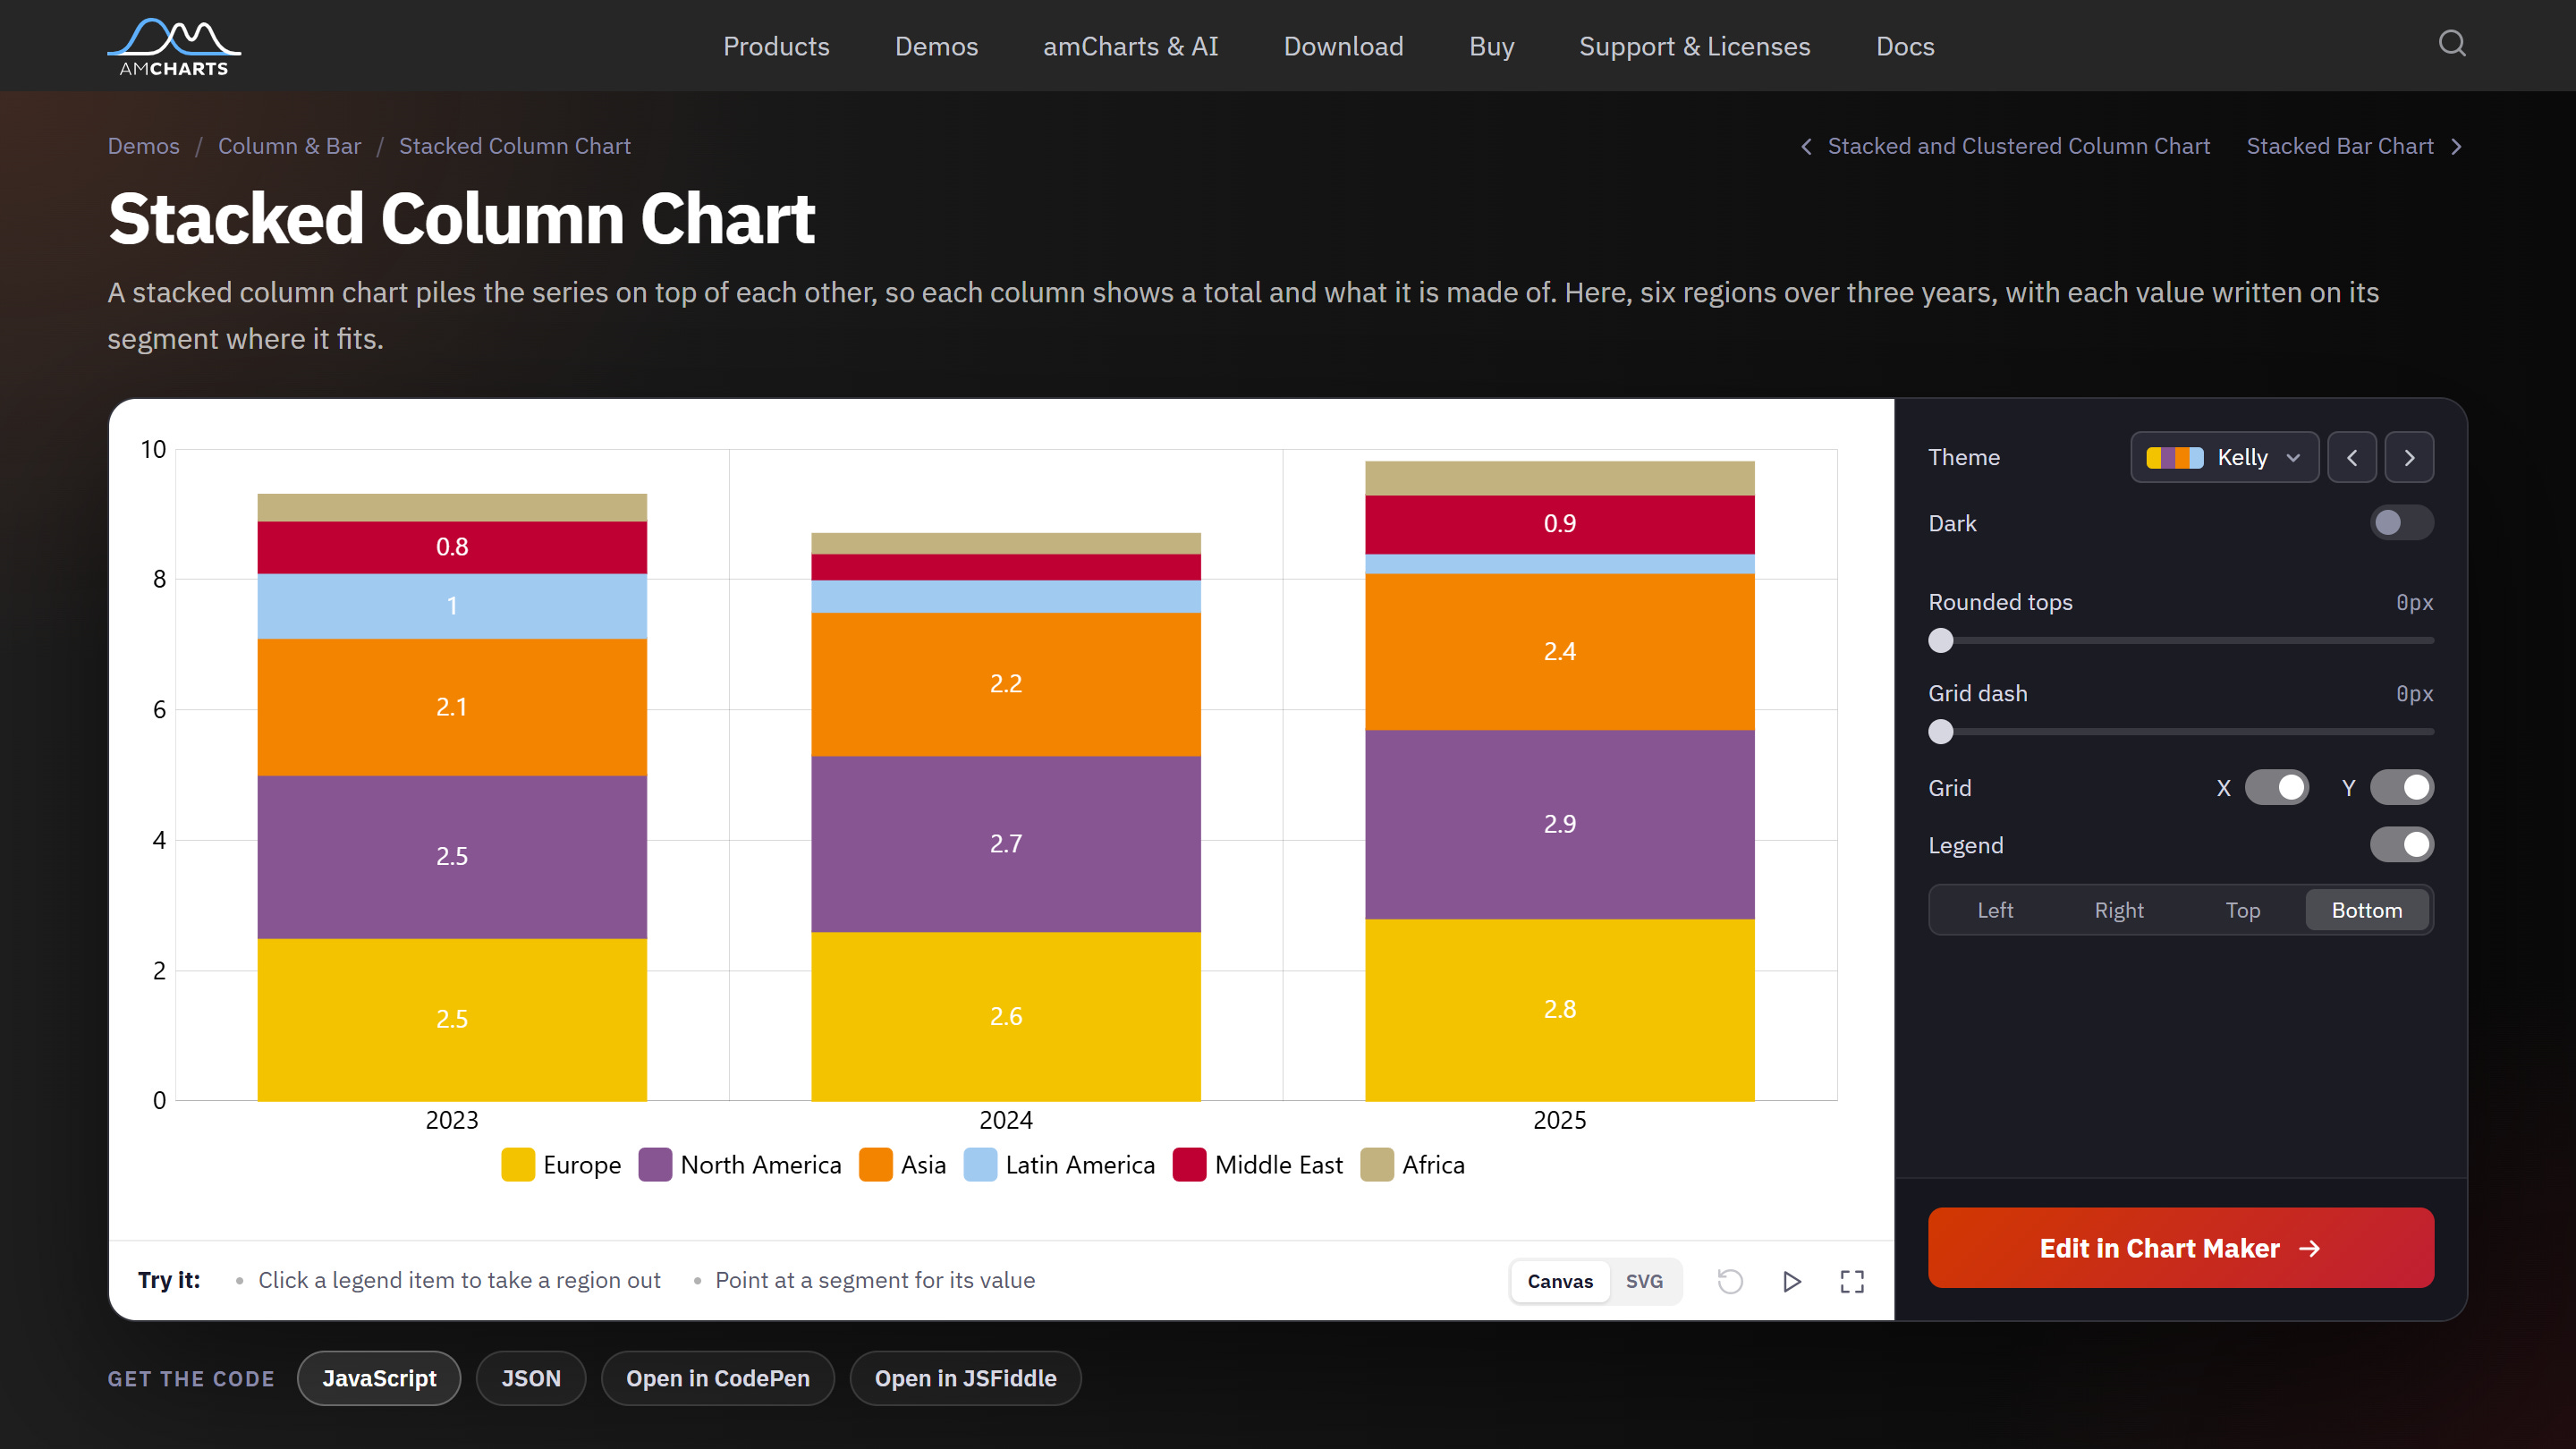
The demos at amcharts.com got an overhaul. They’re less of a gallery now and more of a starting point.
Switch themes, light or dark. Play with the chart’s settings right on the page. Flip between canvas and SVG. When it looks right, take the code as JavaScript, TypeScript, JSON or a full HTML page, or open it in CodePen or JSFiddle.
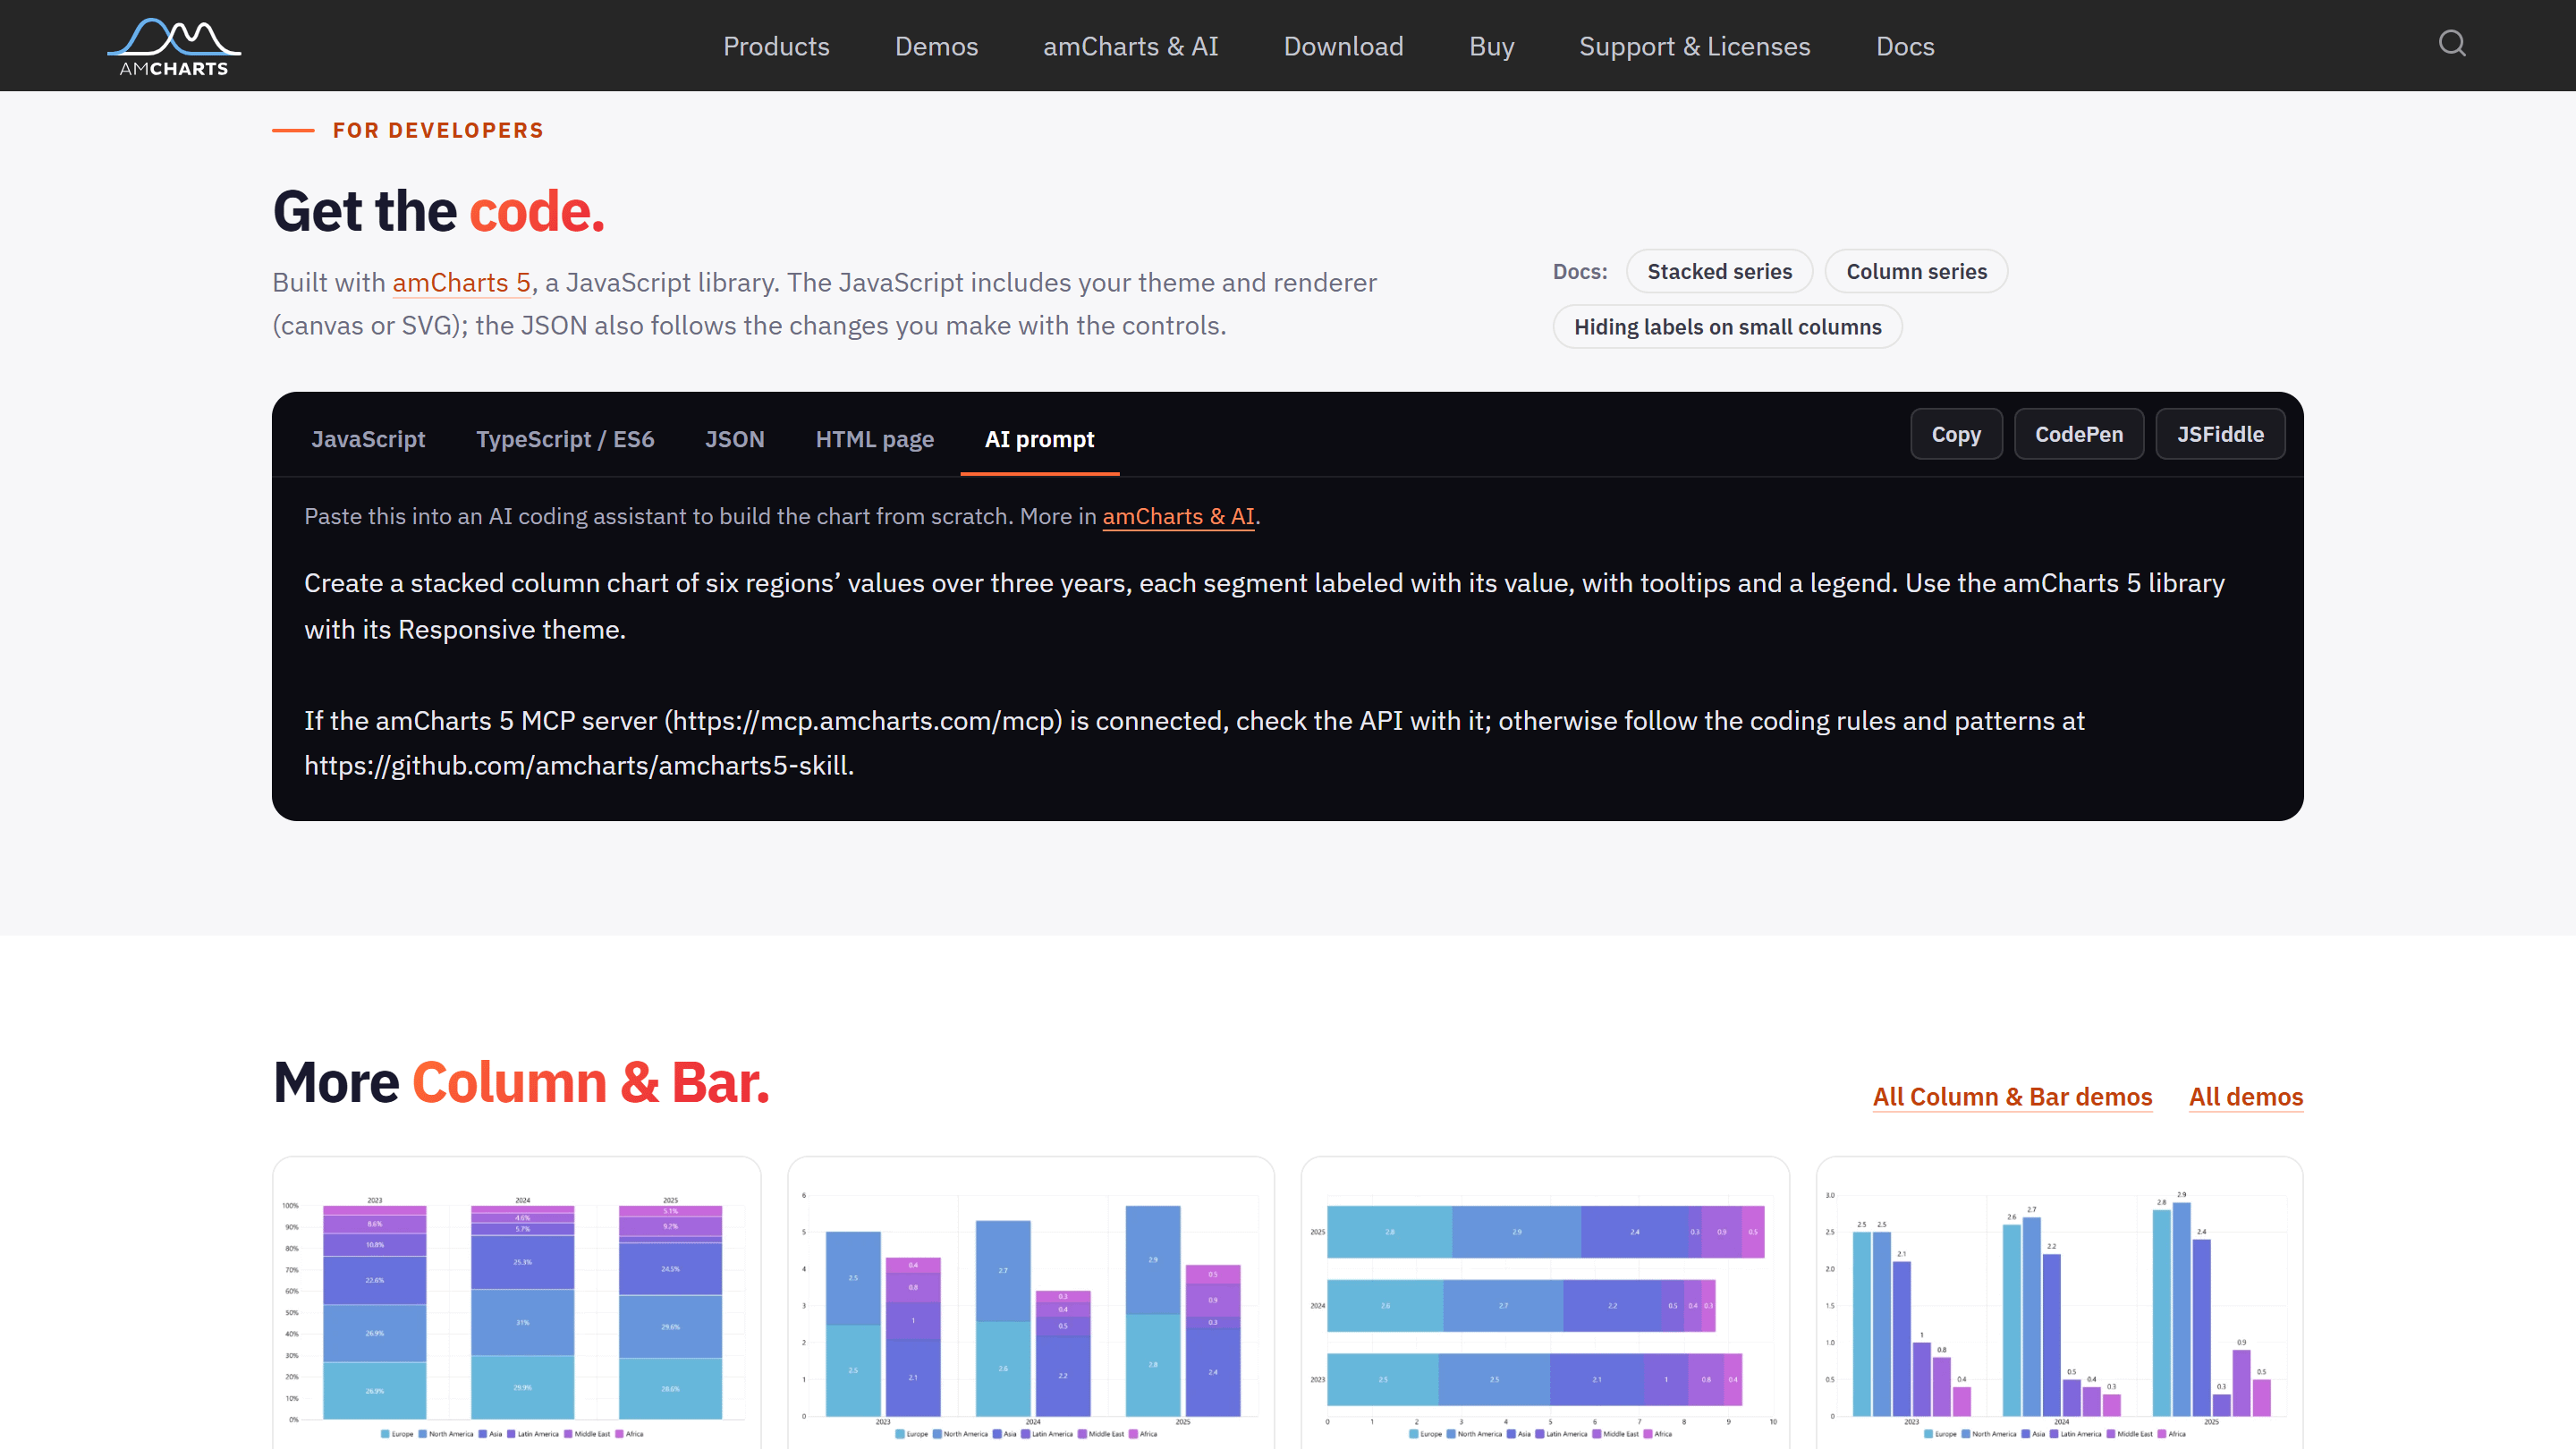
There’s an AI prompt too: paste it into your coding assistant and it builds a chart like the one you’re looking at.
Or skip the code: “Edit in Chart Maker” opens the chart in our online editor.
And the rest
Scrollbars outside the axes, data items that link to a URL, a color per column, word clouds in any shape, and about 100 fixes.
Get it
» npm install @amcharts/amcharts5» CDN: https://cdn.amcharts.com/lib/5/index.js» All download options
Build something with it? Reply and show us.
DataViz Dojo was created by amCharts team. We’re not here to peddle you our data-viz lib. We’re here to have fun with facts, data, cartography, and history, blending it all into beautiful visual stories. Subscribe, follow, or simply check in regularly for more compelling stuff!
