

The Best Statistical Graphic Ever Created
Chart created in 1869 by Charles Joseph Minard, reimagined.


I was recently sorting through my collection of antique maps and assorted artifacts. I have quite a few maps of Lithuania dating back to the early 1600s (I like maps, and I’m Lithuanian -- not exactly a shocking combination). During that process I came across a forgotten 19th-century gravure.
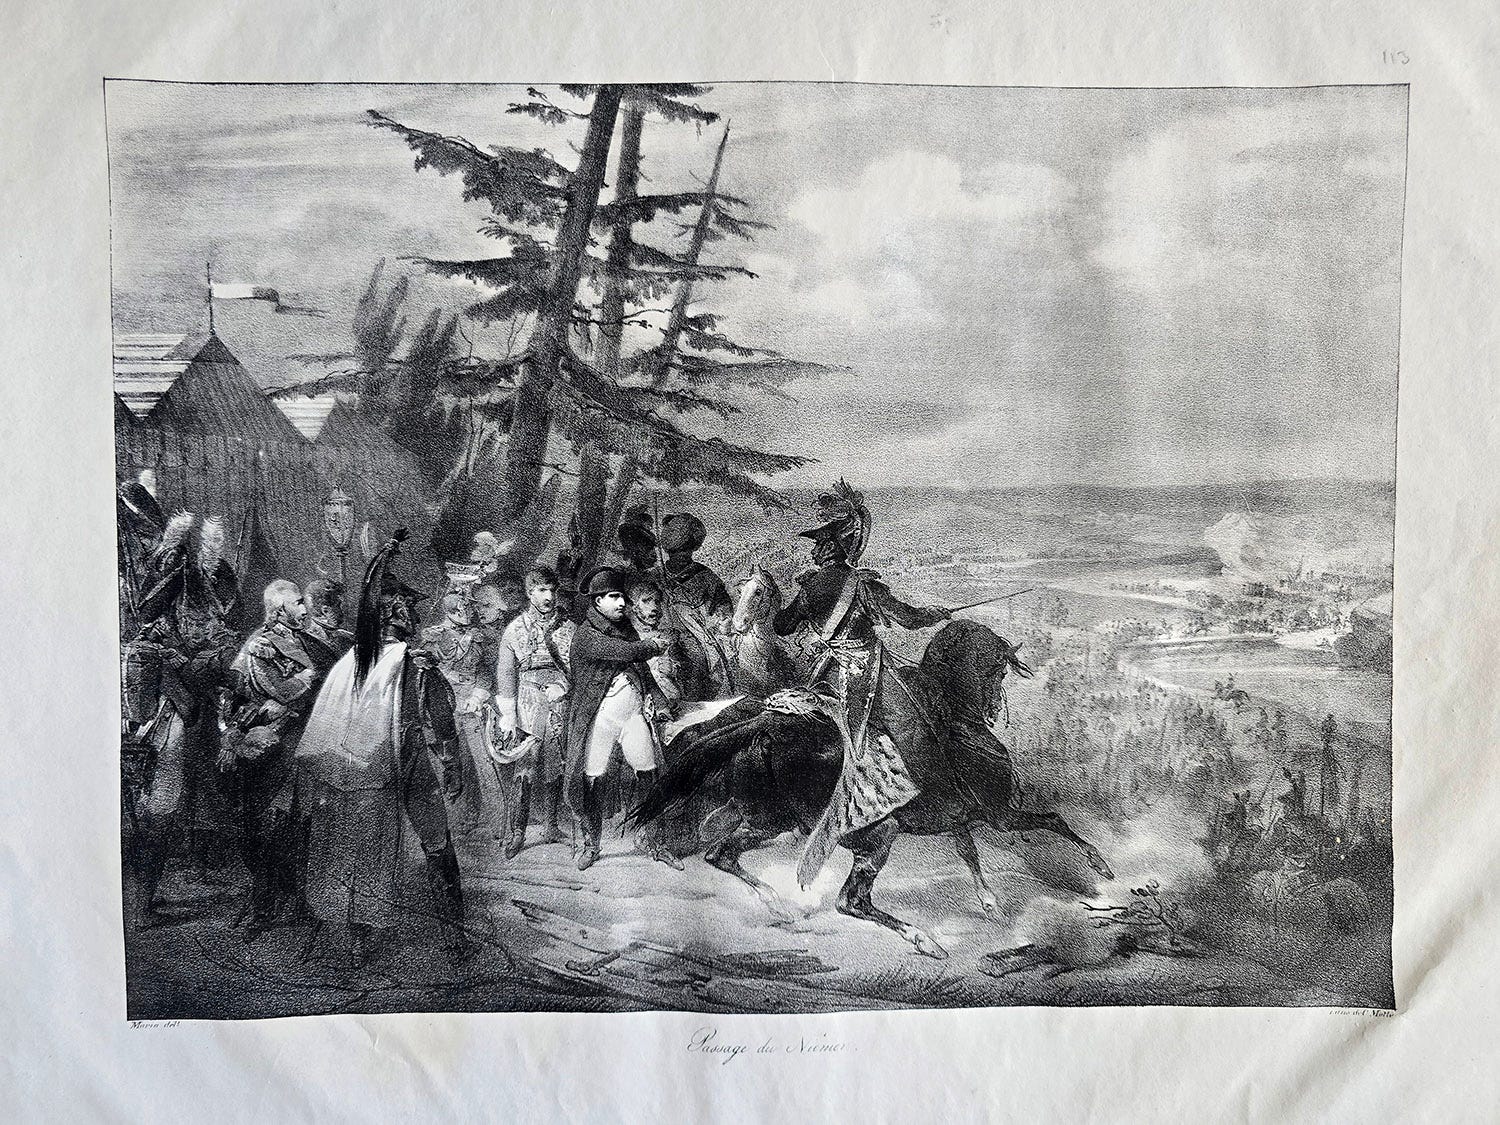
Passage du Niemen, the label at the bottom reads. It shows Napoleon at the very beginning of his infamous march toward Moscow -- the moment his army crosses the Neman (Nemunas) River.
That detail immediately reminded me of a famous data visualization.
If you’re into data visualization, you probably know Edward Tufte -- one of the most recognizable names in the field. In his book The Visual Display of Quantitative Information, he highlights a chart created in 1869 by Charles Joseph Minard and famously calls it “the best statistical graphic ever drawn.”
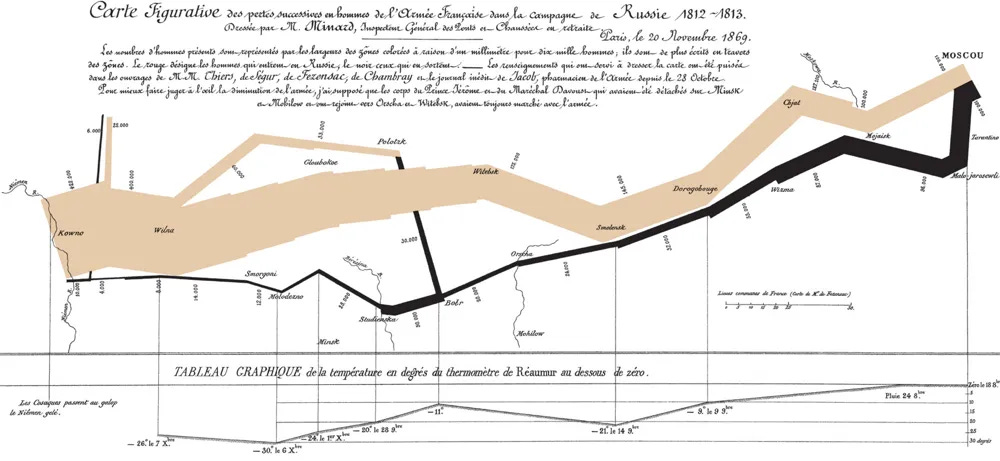
The chart visualizes French invasion of Russia and manages to encode six variables at once: the size of Napoleon’s army, geographic location, direction of movement, temperature, and time -- all in a single coherent two-dimensional graphic.
What’s interesting is where the famous visualization begins. Minard starts the march in Kowno -- today’s Kaunas -- right after Napoleon’s army crosses the Neman River. Exactly the moment depicted in the gravure I found. Seeing that image instantly connected the historical scene with Minard’s visualization in my mind.
I’ve wanted to recreate this remarkable chart using the library I built -- amCharts -- for a long time. What kept stopping me was the data and the time required to reconstruct it properly.
With modern AI tools (in this case, Claude), the process became much more manageable. I spent about five hours gathering the data, adjusting certain points, and refining the design. I’m not claiming the result is perfect, but it’s reasonably close -- and, in my opinion, it looks pretty good.
Take a look and play with it -- it’s interactive.
