



A cartoon from 1812 gave the world a word for redrawing electoral districts. Two centuries on, the redrawing has become so mainstream it’s now a full-on headache for mapmakers.
On 26 March 1812 the Boston Gazette ran a picture of a district. Somebody had taken the outline of a newly drawn state senate seat in Essex County, Massachusetts, added a head, a pair of wings and a set of claws, and captioned it as a new species of monster. The drawing is usually credited to Elkanah Tisdale, and the story goes that he sketched it at a Boston dinner party where the talk had turned to the new map. It looked like a salamander, one of the guests offered. The poet Richard Alsop went one better: the bill had been signed by Governor Elbridge Gerry, so the thing was a gerry-mander.
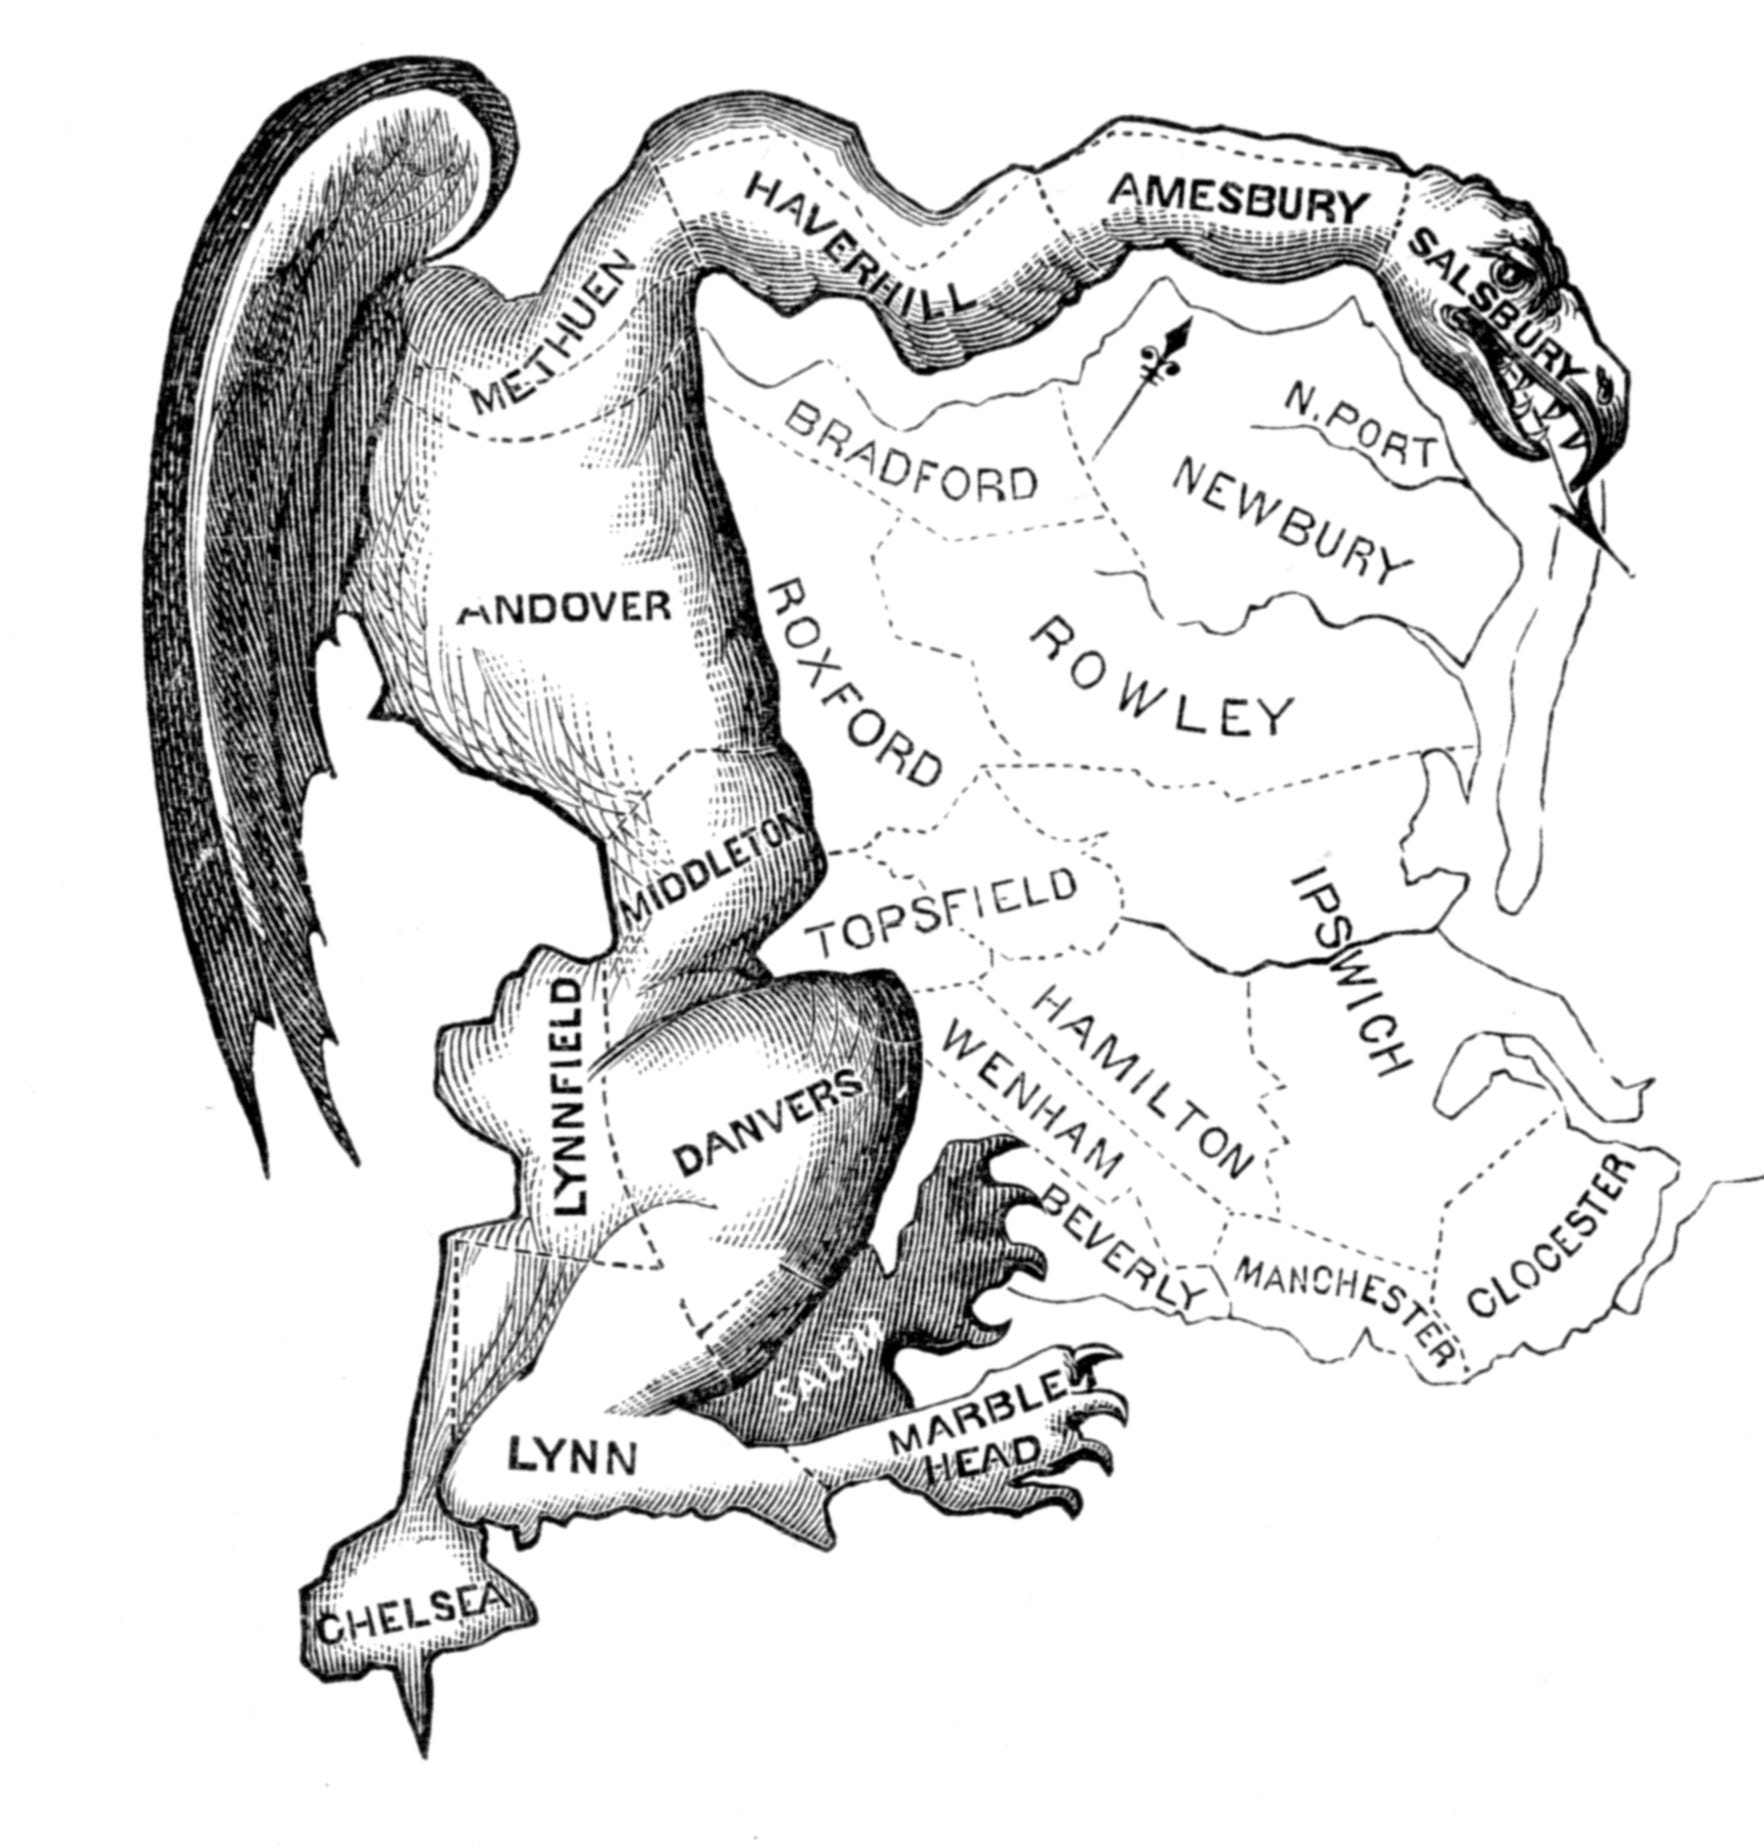
Gerry didn’t like the bill. He thought it was disagreeable but signed it anyway. Ironically, he then lost his own re-election — eleven days after the cartoon ran, but the plan itself worked like a charm: his own Democratic-Republicans, who had drawn the thing, held the state senate by twenty-nine seats to eleven, even though the rival Federalists drew more votes.
What nobody at that dinner anticipated was that a seemingly one-off maneuver would become a powerful, if not a potentially unfair weapon in the political rivalries for the centuries to come.
Structure to chaos
Still, for two hundred years, the whole redistricting thing was kept (more or less) in check by a structure — the census. Count everyone every ten years, redraw the lines, then leave them alone. Redrawing mid-decade was essentially a nineteenth-century habit that barely surfaced in the whole twentieth.
That is pretty much over now. Through 2025 and 2026 a run of states tore up perfectly valid maps and drew new ones, years ahead of the next census. The 120th Congress will be elected in November on boundaries that were still being argued over and challenged as we speak.
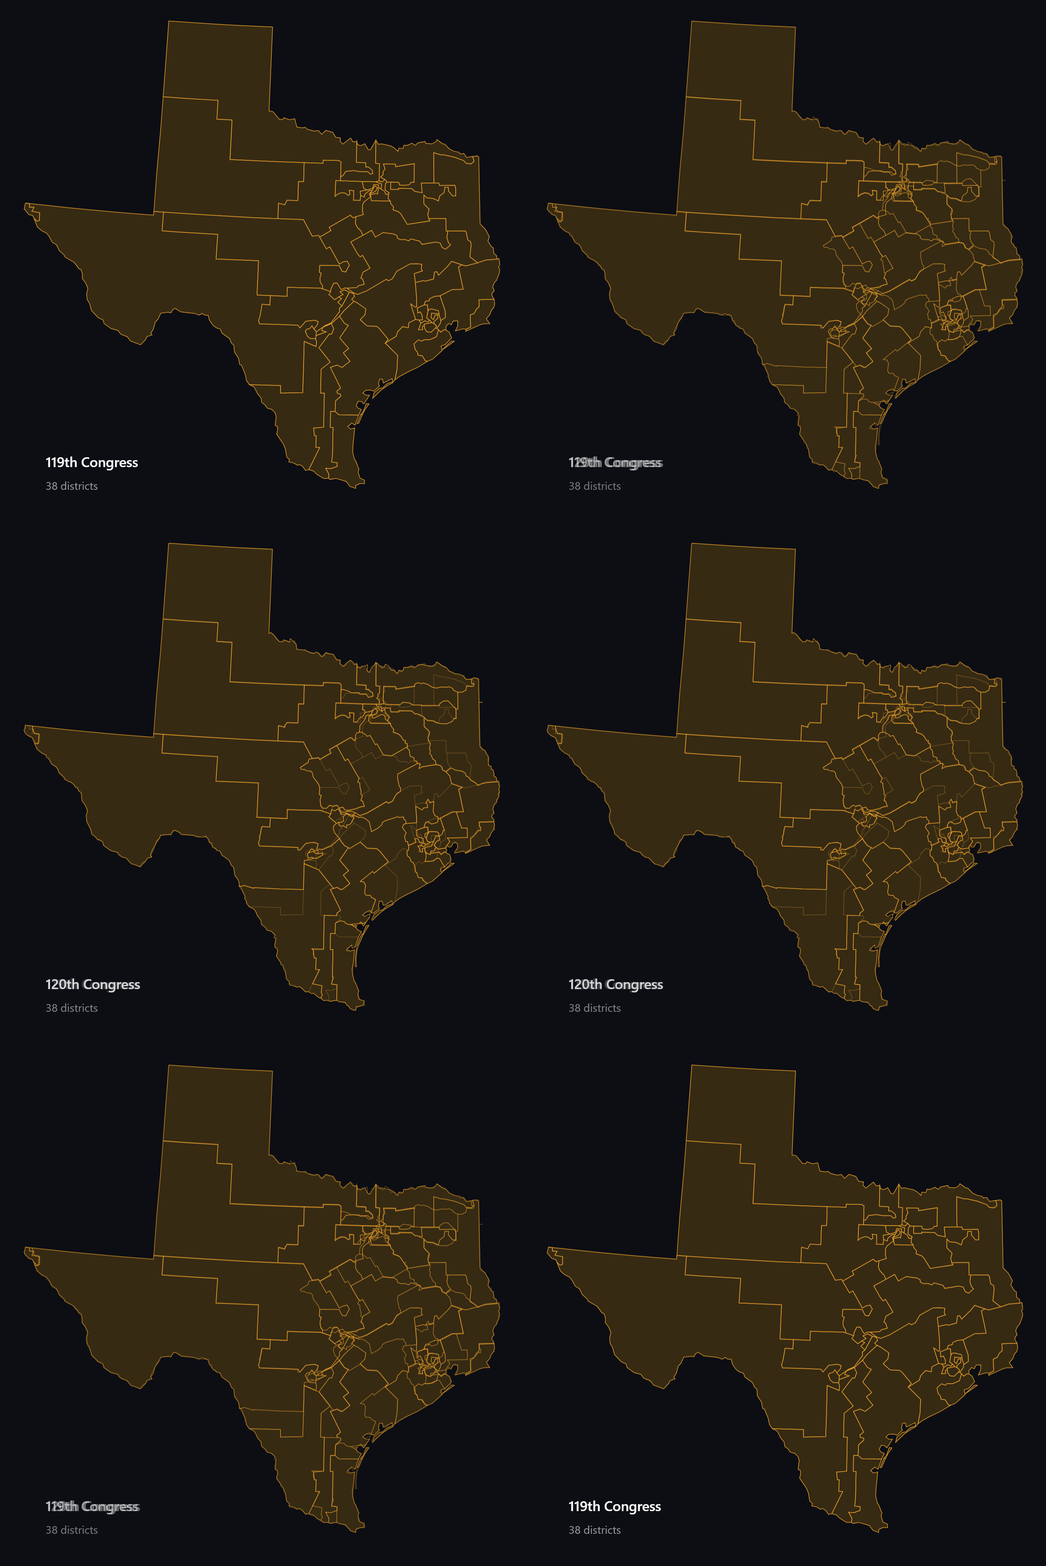
On the political level, it’s “just business”, but on the practical one it’s annoying, to put it mildly. An election is a few months out, and anybody who wants to put it on a map, a newsroom, an analyst, a campaign, a dashboard, needs the actual boundaries — not the ones from the last cycle.
The census won’t help — it isn’t due. The lines exist as legislation and court orders, scattered across a dozen states and arriving on no particular schedule, making it an absolute nightmare for anyone trying to turn it into usable geographic data.
Everyone is just drawing last decade’s districts and hoping nobody notices.
In the interim, there’s a solution
If you just need a configurable static map, the folks at MapChart keep a 120th Congress version up to date, covering the states whose new boundaries are effectively settled: Alabama, California, Florida, North Carolina, Ohio, Tennessee, Texas and Utah.
» MapChart Congressional Districts Map
And if you need the boundaries as an interactive map, we've built the same enacted plans into the congressional120 pack for amCharts 5: Maps.
» Details about 120th Congress map for amCharts
» About amCharts 5: Maps
In closing
Tisdale drew one district, once, and got a permanent word out of it. It would not have occurred to him that the hard part, two centuries later, would be keeping up.
DataViz Dojo was created by amCharts team. We’re not here to peddle you our data-viz lib. We’re here to have fun with facts, data, cartography, and history, blending it all into beautiful visual stories. Subscribe, follow, or simply check in regularly for more compelling stuff!

